Affordable & Liveable Property Guide 2nd Half 2019 - Canberra
A key finding in this report was that units in Canberra were more affordable to residents who wanted to buy in suburbs with high liveability aspects, whereas houses were more expensive. House buyers need to be prepared to pay a 75% premium on top of the Australian Capital Territory (ACT) state average home loan3 to ensure high liveability, whereas unit buyers only needed to pay 10% extra. This is interesting, as the premiums needed to reach the Canberra Metro median price were 65% (houses) and 14% (units). This suggests the need to ensure that affordable housing stock areas are supported by the required infrastructure.

Affordable Suburbs
A key finding in this report was that units in Canberra were more affordable to residents who wanted to buy in suburbs with high liveability aspects, whereas houses were more expensive. House buyers need to be prepared to pay a 75% premium on top of the Australian Capital Territory (ACT) state average home loan3 to ensure high liveability, whereas unit buyers only needed to pay 10% extra. This is interesting, as the premiums needed to reach the Canberra Metro median price were 65% (houses) and 14% (units). This suggests the need to ensure that affordable housing stock areas are supported by the required infrastructure.
Median property prices in Canberra softened by -0.7% for houses to $682,000, and increased by 2.2% for units to $470,000, from 2018 to 20191. Sale transactions declined over the same period, by -26.8% for houses and -28.9% for units, which is reflective of the slower market conditions. By comparison, from 2017 to 2018 the median house price increased by 3.2%, and the median unit price grew by 1.8%, as sales transactions fell -6.6% for houses and -5.0% for units. The recent median house price cooling and reduction in activity is great news for first home buyers. Now is a good time for unit owners to transact, as there has been an increase in capital growth figures, yet an undersupplied market.
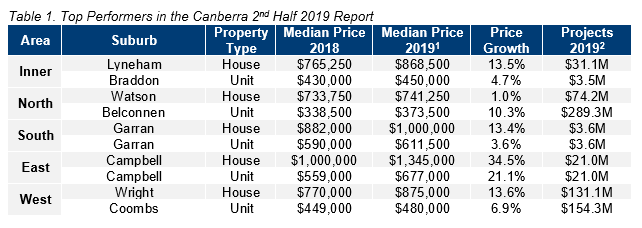
Table 1 highlights Top Performers in the Canberra based on price growth and total estimated value of projects commencing in 2nd Half 2019.
In the 12 months to Q2 2019, the proportion of income to meet home loan repayments decreased by -1.0% in the ACT3, indicating higher affordability. Despite this, the total number of first home buyers entering the market softened by -24.2%, which indicates first home buyer confidence is still recovering. New Federal Government incentives and the latest Reserve Bank of Australia’s cash rate cuts should lift first home buyer confidence for the rest of 2019 and into 2020.
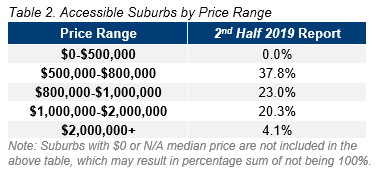
Table 2 provides the percentage of suburbs in Canberra that are available for house buyers.
Liveable Suburbs
Canberra had no suburbs with median house prices under $500,000, which could be viewed as a worrying sign for first home buyers. That said, the weekly median family income for the ACT is the highest nationally5, suggesting an absence of houses under $500,000 may not be a barrier to market entry. The second lowest price range of $500,000-$800,000 had the largest number of suburbs by far (37.8%). This suggests there are plenty of options in the lowest end of Canberra’s market, even if it sits at a slightly higher price point than in other capital cities. There is also a variety of suburbs available between $800,000-$1,000,000 and $1,000,000-$2,000,000, with suburbs above $2,000,000 representing only 4.1% of the market. This means buyers with a range of budgets can access different segments of the market.
Highly affordable house suburbs (those with a maximum property sale price of the state average home loan3, plus a standard mortgage loan 20% deposit), do not exist. No suburbs fell in this range, which suggests affordability in property prices is a concern in Canberra.
Further, many suburbs failed to meet liveability criteria. Premiums of 75% for houses and 10% for units needed to be added to the ACT state average home loan3 in order to satisfy liveability criteria. The low unit premium is a pleasant surprise, as it falls below the 20% standard deposit requirement, suggesting the unit market remains highly affordable. This is reflected further by the premium being below what is needed to reach Canberra’s median unit price premium (14%). Affordability proved to be a greater concern for houses, with the premium required (75%) sitting above the premium needed to reach Canberra’s median house price (65%).
As liveability criteria was difficult to satisfy in Canberra, the criteria were modified. Units with median price growth as close as possible to neutral (i.e zero) were included, as well as suburbs with average vacancy rates slightly above the benchmark (given that the Canberra vacancy rate is very tight at 1.3%).
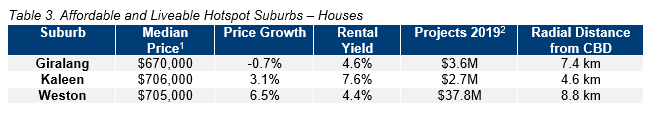
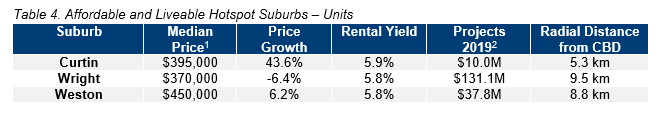
Considering all methodology criteria (property trends, investment, affordability, development, and liveability), Tables 3 and 4 identify key suburbs that property watchers should be on the lookout for.
Affordable & Liveable Suburbs
In Q2 2019, the Canberra rental market recorded a median rental price of $520 per week for houses4 and $470 per week for units4, representing stability in house rental market growth and a minor softening in the unit median rental price by -1.1%. These stable rental levels were achieved alongside a 1.3% vacancy rate, with a slight increase in the 12 months to June 2019. Despite a slight rise, the market remains strongly competitive, sitting in a very low vacancy range. Average yields of 4.0% (houses) and 5.6% (units) in Canberra have remained steady in the 12 months to June 2019.
The 2nd half of 2019 is set for approximately $2.0B2 worth of development with a key focus on mixed-use, infrastructure, and residential projects, as well as notable spending on commercial activity and some industrial activity also. Major projects for the period include the mixed-use development Dickson on Northbourne ($189.9M) which will create 1,000 units and a hotel, the $266.0M National Museum of Australia infrastructure redevelopment project, and the $52.2M John Gorton Drive Apartments which will create 212 apartments. Together, these projects highlight the strength of Canberra’s pipeline for the 2nd half of 2019.
Methodology
This report analyses all suburbs in the ACT area, within a 10km radius of the Canberra CBD. The following criteria were considered:
- Property trends criteria – all suburbs have a minimum of 10 transactions for statistical reliability purposes. Based on market conditions, suburbs have either positive, or as close as possible to neutral price growth, between 2018 to 20191.
- Investment criteria – as of June 2019, all suburbs considered will have an on-par or higher rental yield than Canberra Metro, and an on-par or lower vacancy rate.
- Affordability criteria – identified suburbs have a median price below a set threshold. This was determined by adding percentage premiums to the ACT average home loan, which was $413,3773 as of Q2 2019. Premiums of 75% for houses and 10% for units were added, which for houses is above the required to reach Canberra Metro’s median price (65%) and for units is below (14%). Unit suburbs identified in this report are more affordable, and house buyers need to sacrifice on affordability to meet liveability and/or investment criteria.
- Development criteria – all suburbs identified within this report have a high total estimated value of future project developments for the 2nd half of 20192, as well as a higher proportion of commercial and infrastructure projects. This ensures suburbs chosen show signs of sustainable economic growth, which in turn has a positive effect on the property market.
- Liveability criteria – this included ensuring all suburbs assessed have low crime rates, availability of amenities within a 5km radius (i.e. schools, green spaces, public transport, shopping centres and health care facilities), and an unemployment rate on-par or lower in comparison to the state average (as determined by the Department of Jobs and Small Business, March Quarter 2019 release).
PRD Affordable and Liveable Property Guide 2H 2019 - Canberra


