Q3 2018 Key Market Indicators – Tasmania
TAS took out the bronze award nationally for highest number of dwelling approvals growth in Q3 2018 Key Market Indicator Awards, at 14.1% over the past 12 months to June 2018. This is quite significant as it is double the growth quoted in Q2 2018 Key Market Indicator series, which recorded a 7.4% increase over the past 12 months to March 2018. What’s more, TAS’s nett migration declined by -10.2% over the past 12 months to December 2017, suggesting there are less people needing a home. This assists in creating a more balanced demand and supply in the property market.
Tasmania relieves its high housing demand, bringing a more positive outlook for its affordability levels in the near future.
The Tasmania (TAS) property market fared better in the Q3
2018 Key Market Indicator Awards, regarding providing housing supply to meet
increasing demand, number of first home buyer loan growth, and home loan
affordability index growth.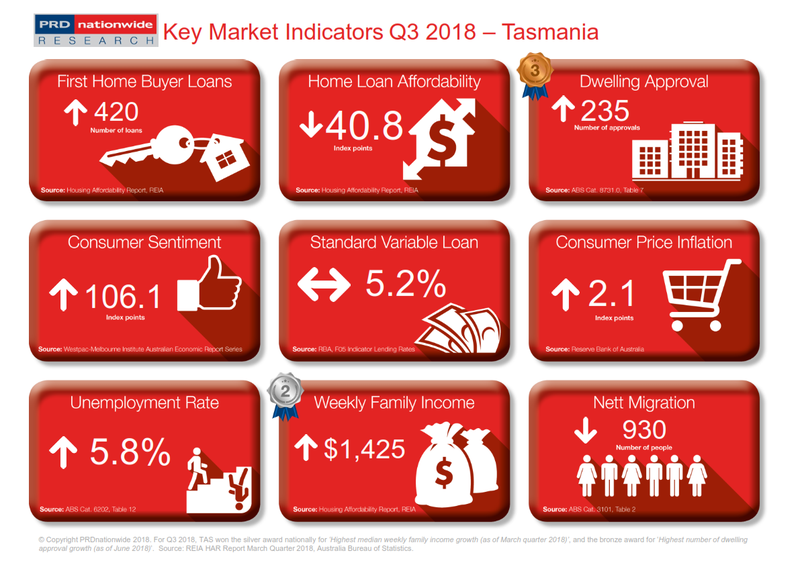
TAS took out the bronze award nationally for highest number of dwelling approvals growth in Q3 2018 Key Market Indicator Awards, at 14.1% over the past 12 months to June 2018. This is quite significant as it is double the growth quoted in Q2 2018 Key Market Indicator series, which recorded a 7.4% increase over the past 12 months to March 2018. What’s more, TAS’s nett migration declined by -10.2% over the past 12 months to December 2017, suggesting there are less people needing a home. This assists in creating a more balanced demand and supply in the property market.
TAS takes out the silver award nationally for highest median weekly family income growth, at 2.6% over the past 12 months, bringing the median weekly family income to $1,425 in March quarter 2018. This is similar to Q2 2018 Key Market Indicator, whereby TAS also took out the silver award nationally for the same category.
The two factors above, combined, has led to an improvement in TAS’s home loan affordability index. In Q2 2018 Key Market Indicator TAS’s home loan affordability declined by -5.4% over the past 12 months to December 2017, which is quite unusual for TAS. In Q3 2018 Key Market Indicator TAS’s home loan affordability started to bounce back, recording a softer decline, of -3.8% over the past 12 months to March 2018. Furthermore, TAS’s first home buyer loan growth over the past 12 months to March 2018 was 6.9%, an improvement compared to the 4.0% growth over the past 12 months to December quarter 2017. This brings a more positive outlook for TAS’s property price affordability.
The PRD Q3 2018 Key Market Indicators provide a quick snapshot of the current state of the market in Australia from both an economic and property perspective. The Indicators cover both national and state level data, comprising of:
- Number
of loans to first home buyers
- Home
loan affordability index
- Number
of dwelling approvals
- Consumer
sentiment index
- Standard
variable loan
- Consumer
price inflation index
- Unemployment
rate
- Weekly
family income
- Nett
migration
View the Q3 2018 Key Market Indicators


