Affordable & Liveable Property Guide 1st Half 2019
The PRD Affordable and Liveable Property Guides 1st Half 2019 are available for Sydney, Melbourne, Brisbane, and Hobart. These property guides provide valuable insights and highlights for the market, and report on many key indicators to create a holistic picture of the property conditions in each capital city.

The PRD Affordable and Liveable Property Guides 1st Half 2019 are available for Sydney, Melbourne, Brisbane, and Hobart. These property guides provide valuable insights and highlights for the market, and report on many key indicators to create a holistic picture of the property conditions in each capital city.
There
were several surprise findings in the 1st
Half 2019 reports:
We were able to find affordable and liveable suburbs in different pockets of
Brisbane, resulting in a good spread geographically. This contrasts with the 2nd Half 2018¥ report,
where all identified affordable and liveable house suburbs were concentrated on
the northside.
- All affordable and liveable suburbs identified in Sydney had negative annual median price growth, which is a sign of market cooling. Thus, instead of showcasing suburbs with the highest price growth, which has been the trend over the past 4-5 years, the 1st Half 2019 report became an exercise in minimising the decline in capital growth. This has been a continued finding since the 2nd Half 2018¥ report, and therefore offers further great news for first home buyers.
- None of the affordable suburbs in Hobart were able to satisfy the liveability criteria. To ensure liveability aspects were met, the median suburb price had to be raised above the Hobart Metro median price. This increased median price was continued from the 2nd Half 2018¥ report, which suggests that buyers in Hobart must sacrifice affordability to meet liveability and/or investment criteria.
- In Melbourne, the proportion of house sales in the lowest bracket (below $500,000) increased from 1.9% to 4.0% over the past 12 months (to the 1st half of 2019). This is a price point shift that has not occurred over the past 3 years. Houses priced between $1,000,000-$2,000,000 are no longer the dominant price point, and have declined in sales activity from 52.4% to 29.1%, with sales transactions seemingly being distributed towards lower price points during the 1st half of 2019.
- The Brisbane property market is currently in its prime for first home buyers, with the proportion of available suburbs with properties in the sub-$500,000 price bracket reaching a record high of 42.4%. This is extremely encouraging news for Brisbane first home buyers, as it signals a flip in the market from being a $500,000-$800,000 market to an under $500,000 property market.
Table 1 illustrates liveability costs among the
capital cities, with Melbourne proving to have the highest average liveability
cost at 35%. This is a change from the 2nd
Half 2018¥ report, in
which Hobart took this title. In the 1st
Half 2019 reports, Sydney and Brisbane have proven to be the most liveable
cities, with an average liveability cost of 2% for Brisbane and 3% for Sydney.
This is a continued pattern since the 2nd
Half 2018¥ report.
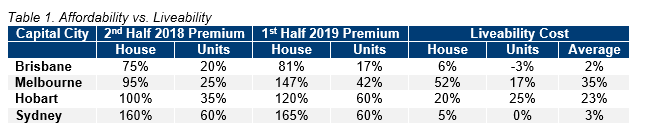
It is important to note that these premium percentages are affected by two key variables: median price movements in the market, and the ability of a suburb to meet the liveable criteria set. In Sydney, Melbourne and Brisbane there was some median price softening, however affordable suburbs did not always meet the liveability criteria. The premium percentage added to the relevant state average loan therefore needed to be increased to widen the pool of suburb choices.
If only based on house premium percentage, then Melbourne would have maintained its position as the most expensive city to live in. This is surprising, as for several years Melbourne has been nominated as one of the most liveable cities in the world. Interestingly, if based on a premium percentage for units, the most expensive city to live in would have been Hobart.
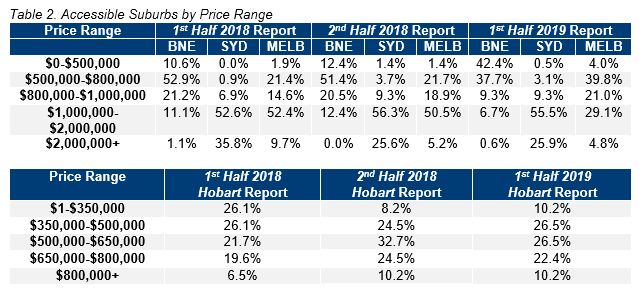
First home buyer activity continues to be a focal point in the 2019 property market. Table 2 suggests there is increasing hope for first home buyers, particularly in Brisbane. The less than $500,000 price range increased in Sydney and Melbourne between the 1st half of 2018 to the 1st half of 2019, from 0.0% to 0.5% in Sydney, and 1.9% to 4.0% in Melbourne. Brisbane has therefore truly emerged as the best capital city for first home buyers, with the less than $500,000 price bracket increasing significantly from 10.6% to 42.4%.
Interestingly, Hobart, known as the more affordable capital city for many years, is the one state currently least approachable to first home buyers, especially those with a budget of less than $350,000. Property with a $350,000 price point in Hobart has more than halved from 26.1% to 10.2%. That said, there is hope, as each price range above $350,000 has roughly recorded a similar market presence, meaning there is ample opportunity for buyers with a range of different budgets.
Premium markets (above $2,000,000) have decreased in sales activity in Brisbane, Sydney and Melbourne, with the largest decline found in Sydney (from 35.8% to 25.9% over the past 12 months to the 1st half of 2019). This further confirms a cooling in the Sydney property market, which is seeing it return to a more sustainable level of growth.
Interestingly,
the premium market for Hobart ($800,000+) has grown from 6.5% to 10.2% over the
past 12 months. This suggests there may be a concentrated shift in buyer
activity across capital cities, creating more affordability in Brisbane, Sydney
and Melbourne, and causing price hikes in Hobart. Although this has been a recurring
pattern over the past 12 months, we are now seeing definite results from this
activity. Hobart was the only capital city where the percentage premium added
to its affordable and liveable suburbs had to be above what was added to the
other states. This was in order to reach the Hobart median price (as per
affordability criteria). This means that there soon needs to be a strategic
re-think of infrastructure development in Hobart and its surrounding areas.
The PRD
Affordable and Liveable Property Guides 1st Half 2019 series aims
to identify affordable and liveable suburbs within 20km of each capital city’s
CBD (or 10km for Hobart). Considering all methodology
criteria (property trends, investment potential, affordability, project
development, and liveability factors), Table 3 identifies key affordable and
liveable suburbs that property watchers should look out for.
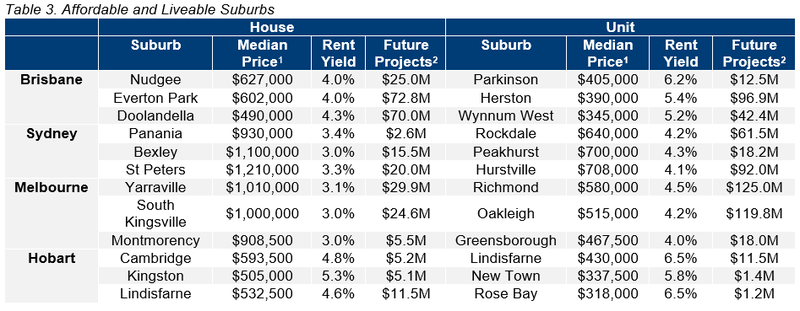
After looking at the affordable and liveable
suburbs identified in Table 3, it is evident that in general, Sydney and
Melbourne have the highest entry prices, yet the lowest rental yields. This is a
refreshing change from the 1st
Half 2018µ and 2nd
Half 2018¥ reports, in
which Sydney took out this title. Despite a shift towards more premium pricing
within the local Hobart market, it still provides the most affordable option and
highest rental yield nationally. However, some Hobart suburbs have recorded
similar median prices to Brisbane in the 1st half of 2019, which
confirms its swing towards a higher priced property market.
Methodology
Each PRD Affordable and Liveable Property Guide 1st Half 2019 report focuses on suburbs within a 20km radius of the CBD (or 10km for Hobart), taking into consideration the following criteria:
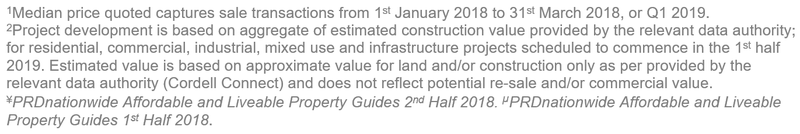
- Property trends criteria – all suburbs considered have a minimum of 20 transactions for statistical reliability purposes (or 10 for Hobart), along with positive price growth from 2017 to 2018/19**.
- Investment criteria – as of December 2018, all suburbs considered will have an on-par or higher rental yield than the nearest capital city metro area, and an on-par or lower vacancy rate.
- Affordability criteria – suburbs required a median price below a specified threshold. This threshold was set by adding a percentage premium to the respective state’s average home loan. This percentage premium must result in a price threshold below the capital city’s median price in order to ensure affordability.
- Development criteria – all suburbs reviewed have a high total estimated value of project development for the 1st half of 2019, as well as a higher proportion of commercial and infrastructure projects. This ensures sustainable economic growth, which in turn has a positive effect on the property market.
- Liveability criteria – all suburbs assessed must have low crime rate, availability of amenities within a 5km radius (i.e. schools, green spaces, public transport, shopping centres, and health care facilities), and an unemployment rate on-par or lower in comparison to the state average (as determined by the Department of Jobs and Small Business, December Quarter 2018 release).
View the Capital City Guides
Brisbane - Affordable & Liveable Property Guide 1st Half 2019
Sydney - Affordable & Liveable Property Guide 1st Half 2019
Melbourne - Affordable & Liveable Property Guide 1st Half 2019
Hobart - Affordable & Liveable Property Guide 1st Half 2019


