Affordable & Liveable Property Guide 1st Half 2020 - Hobart
Hobart Metro’s median price growth has shown improvement, showing the market is moving from strength to strength. Sustainable population growth remains a challenge due to continued new dwelling supply constraints. This is evident through low vacancy rates across the city and is likely to continue to put upward pressure on sale and rental prices.

Overview
Median property prices in Hobart Metro increased by 7.0% for houses to $558,500 and by 12.8% for units to $443,500 from 2018 to 2019/20(1). By comparison, from 2017 to 2018 the median house price increased by 10.8%, and the median unit price softened by -7.4%.
Hobart Metro’s median price growth has shown improvement, showing the market is moving from strength to strength. Sustainable population growth remains a challenge due to continued new dwelling supply constraints. This is evident through low vacancy rates across the city and is likely to continue to put upward pressure on sale and rental prices.
A key finding in this report was that in order to identify affordable and liveable areas, rental performance of suburbs was reconsidered. Suburbs that had a vacancy rate marginally above Hobart Metro’s already tight vacancy rate were allowed, as well as suburbs with unit rental yields below Hobart Metro’s average.
This methodology was applied as at the time of the report’s creation, the impacts of COVID-19 on the property market were most evident in these investment criteria. Despite this change, suburbs identified remain quite strong overall, even from an investment perspective, due to ongoing tight rental market conditions across Hobart Metro.
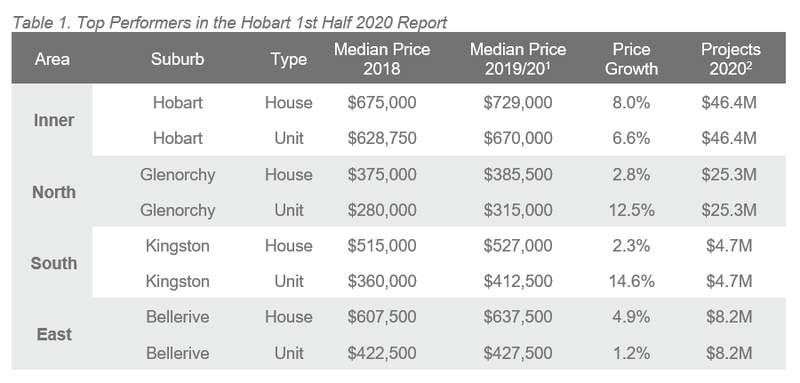
Table 1 highlights top suburbs in Hobart Metro based on price growth and total estimated value of projects commencing in the 1st half of 2020(2).
Access to Market
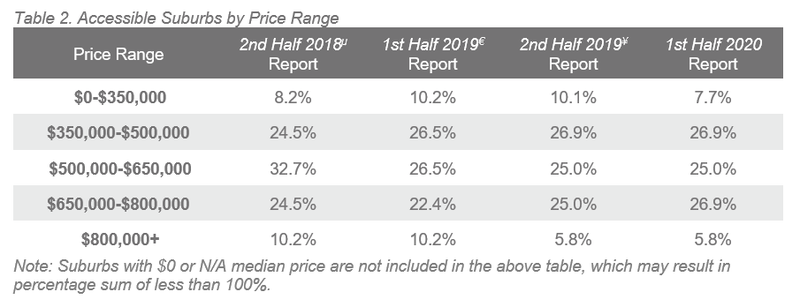
The number of suburbs available in the less than $350,000 price bracket shrunk slightly from 10.1% in the 2nd Half 2019(µ) report to 7.7%. The most affordable suburbs in Hobart Metro are now fewer in number, and as a result, the market is less accessible for first home buyers. Every other price bracket remains identical to the 2nd Half 2019(µ) report however, suggesting that home values in Hobart Metro are stable, which is great news for buyers and owners alike.
Table 2 provides the percentage of suburbs in Hobart that are available for house buyers.
Affordable and Liveable Suburbs
In the 1st half of 2020 premiums of 68% for houses and 25% for units needed to be added to the Tasmania (TAS) average home loan in order to satisfy the liveability criteria. These premiums are well below those in the 2nd Half 2019(µ) report, revealing that there has been a decrease in the cost of liveability.
That said, a premium of 68% for houses is higher than the 63% premium needed to reach Hobart Metro’s median price. Although there is an improvement in the number of suburbs accessible by homebuyers and the percentage premium added to the state average home loan, Hobart house buyers still, in most cases, need to choose between affordability and liveability.
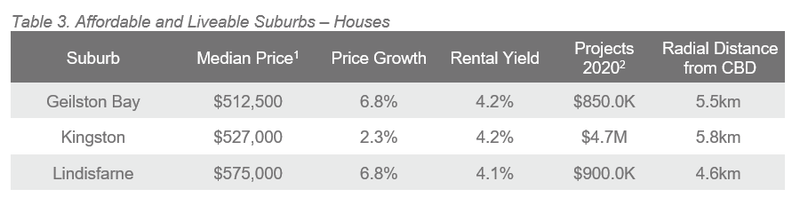
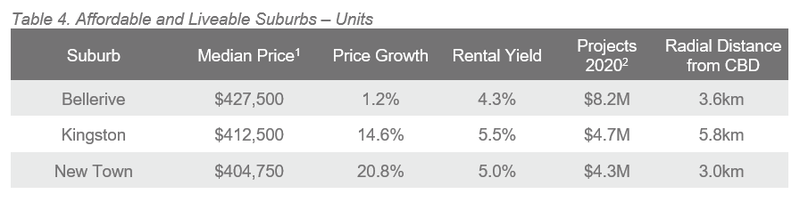
Considering all methodology criteria (property trends,
investment, affordability, development, and liveability), Tables 3 and 4
identify key suburbs that property watchers should be on the lookout for.
Over Q1 2020, the Hobart Metro rental market recorded a median rental price of $460 per week for houses and $395 per week for units, representing quarterly median house rental growth of 2.2% and strong growth of 16.2% in the median unit rental price. Hobart Metro also recorded a very low vacancy rate of 1.4%, which has slightly lifted in the 12 months to April 2020. Average yields of 3.9% (houses) and 5.7% (units) are reflective of these tight vacancy levels. The lack of additional supply in Hobart Metro’s property market should keep vacancy rates low, which is good news for investors.
The 1st half of 2020 is set to see approx. $185.4M(2) of development across Greater Hobart, with a major focus on infrastructure projects, which will improve services and liveability aspects for residents. A limited residential supply pipeline is still a cause for concern, as it creates housing affordability issues; however, this provides developers with a great opportunity. A key infrastructure project is the $37.6M Hobart International Airport Road Upgrade. Projects such as this will help create new jobs and tourism opportunities for Greater Hobart.
Methodology
This affordable and liveable property guide for Hobart analyses all suburbs in the Greater Hobart area, within a 10km radius of the Hobart CBD. The following criteria were considered:
- Property trends criteria – all suburbs have a minimum of 10 sales transactions for statistical reliability purposes. Based on market conditions suburbs have either positive, or as close as possible to neutral price growth from 2018 to 2019/20(1).
- Investment criteria – as of April 2020, all suburbs considered will have an on-par or higher rental yield than Hobart Metro, and a similar or lower vacancy rate.
- Affordability criteria – identified suburbs have a median price below a set threshold. This was determined by adding percentage premiums to the TAS average home loan, which was $343,649(3) as of Q1 2020. Premiums of 68% for houses and 25% for units were added, which for houses is above the required to reach Hobart Metro’s median price (63%), and for units is below (29%). Unit suburbs identified are more affordable, however house buyers need to sacrifice on affordability to meet liveability and/or investment criteria.
- Development criteria – suburbs identified within this report have a high total estimated value of future project development for the 1st half of 2020(2), as well as a higher proportion of commercial and infrastructure projects. This ensures the suburbs show signs of sustainable economic growth, in turn having a positive effect on the property market.
- Liveability criteria – this included ensuring all suburbs assessed have low crime rates, availability of amenities within a 5km radius (i.e. schools, green spaces, public transport, shopping centres and health care facilities), and an unemployment rate on-par or lower in comparison to the state average (as determined by the Department of Jobs and Small Business, December Quarter 2019 release).
Affordable and Liveable Property Guide 1st Half 2020 - Hobart


