Affordable & Liveable Property Guide 2nd Half 2019 - Perth
A key finding in this report was that liveability comes at a high price in Perth. A premium percentage of 140% for houses and 60% for units needed to be added to the average Western Australia (WA) state average home loan3, in order to identify suburbs that satisfy liveability criteria. This is above the levels needed to reach Perth’s median house and unit price (94% for houses and 26% for units). Perth joins Adelaide, Canberra and Hobart in this regard.

Affordable Suburbs
A key finding in this report was that liveability comes at a high price in Perth. A premium percentage of 140% for houses and 60% for units needed to be added to the average Western Australia (WA) state average home loan3, in order to identify suburbs that satisfy liveability criteria. This is above the levels needed to reach Perth’s median house and unit price (94% for houses and 26% for units). Perth joins Adelaide, Canberra and Hobart in this regard.
Median property prices in Perth softened by -5.2% for houses to $653,500 and remained stable for units at $425,750 from 2018 to 20191. Sale transactions declined over the same period, by
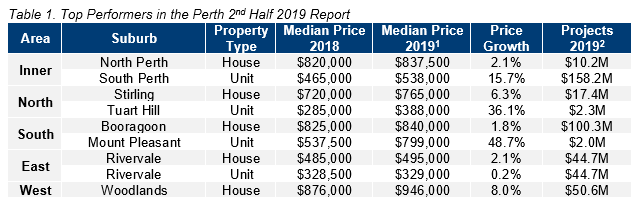
-31.6% for both houses and for units, which is reflective of the slower market conditions. By comparison, from 2017 to 2018 the median house price in Perth increased by 0.7%, and median unit price dropped by -2.0%, while sale transactions fell -5.3% for houses and -13.4% for units. The recent, and more significant reduction in market activity is great news for first home buyers. Table 1 highlights top suburbs in Perth based on price growth and total estimated value of projects commencing in the 2nd half of 20192.
In the 12 months to Q2 2019, the proportion of income to meet home loan repayments decreased by 6.3% in WA3. Despite this, the total number of first home buyers entering the market softened by -7.5%, indicating first home buyer confidence is still recovering. New Federal Government incentives and the latest Reserve Bank of Australia’s cash rate cuts should lift first home buyer confidence.
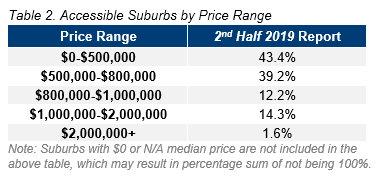
Table 2 provides the percentage of suburbs in Perth that are available for house buyers
Liveable Suburbs
Perth remains a highly affordable market, with 36.9% of suburbs with a median house price of less than $500,000. The next price bracket of $500,000-$800,000 offers a similarly significant 33.3% of suburbs. This means more than 70% of suburbs in Perth sit below $800,000. A healthy proportion of suburbs sit between $800,000-$1,000,000 (10.4%) and between $1,000,000-$2,000,000 (12.2%), with just three suburbs (1.4%) sitting above $2,000,000. First home buyers can capitalise on affordability in Perth, while mid-range and premium priced homeowners can be confident of capital growth.
Highly affordable suburbs (those with a maximum property sale price of the average state loan, plus a standard mortgage loan 20% deposit), do exist. There were 43 suburbs in this range, suggesting affordable property is available in Perth.
Despite this apparent affordability, many of these suburbs fail to meet either liveability, investment, and/or project development criteria. Premiums of 140% for houses and 60% for units needed to be added to the average WA state average home loan3 in order to identify suburbs which satisfy all other methodology criteria. These premiums are also above the levels needed to reach Perth’s median house and unit price (94% for houses and 26% for units). The recent market cooling has done little to improve the choices of residents who put great emphasis on liveability in Perth, despite affordability.
Liveability criteria was particularly difficult to satisfy for units in Perth, and as a result the criteria had to be modified. Units with price growth as close as possible to neutral (i.e. zero) were considered, as well as suburbs with average rental yields slightly below the Perth Metro benchmark. This highlights the need to address the issue of liveability and investment potential in affordable areas.
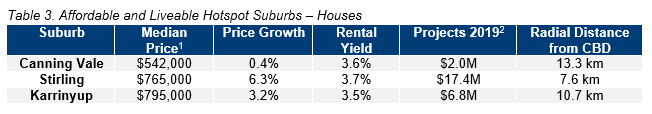
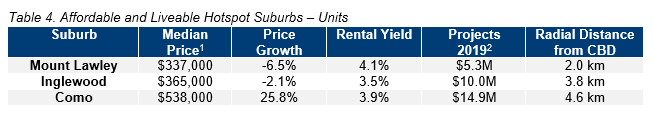
Considering all methodology criteria (property trends, investment, affordability, development, and liveability), Tables 3 and 4 identify key suburbs that property watchers should be on the lookout for.
Affordable & Liveable Suburbs
In Q2 2019, the Perth rental market recorded a median rental price of $340 per week for houses4 and $325 per week for units4, representing stability in median rental price growth for both property types. Stable median rental prices were alongside a 3.2% vacancy rate, which decreased from 4.1% in the 12 months to June 2019. This suggests the rental market is moving into a healthier position, as existing supply is being absorbed. Average yields of 3.5% (houses) and 4.5% (units) have both improved over the same period - great news for investors.
The 2nd half of 2019 is set for approximately $1.9B2 worth of development with a well-balanced focus on infrastructure, mixed-use, commercial, and residential projects, as well as a small level of industrial activity. Key projects for the period include the $146.0M infrastructure project Armadale Road to North Lake Bridge, the $150.0M Curtin University School of the Built Environment, the redevelopment of the White Sands Hotel (mixed-use project set to construct 246 apartments), and the $70.0M residential project Peninsula Tower 6 (176 apartments).
Methodology
This report analyses all suburbs in the Greater Perth area, within a 20km radius of the Perth CBD. The following criteria were considered:
- Property trends criteria – all suburbs have a minimum of 10 transactions for statistical reliability purposes. Based on market conditions, suburbs have either positive, or as close as possible to neutral price growth, between 2018 to 20191.
- Investment criteria – as of June 2019, all suburbs considered will have an on-par or higher rental yield than Perth Metro, and an on-par or lower vacancy rate.
- Affordability criteria – identified suburbs have a median price below a set threshold. This was determined by adding percentage premiums to the WA average home loan, which was $337,1493 as of Q2 2019. Premiums of 140% for houses and 60% for units were added, which were above those required to reach Perth Metro’s median prices (94% for houses and 26% for units). This places the suburbs above Perth’s median prices. Buyers in Perth need to sacrifice on affordability to ensure liveability and/or investment potential.
- Development criteria – all suburbs identified within this report have a high total estimated value of future project developments for the 2nd half of 20192, as well as a higher proportion of commercial and infrastructure projects. This ensures suburbs chosen show signs of sustainable economic growth, which in turn has a positive effect on the property market.
- Liveability criteria – this included ensuring all suburbs assessed have low crime rates, availability of amenities within a 5km radius (i.e. schools, green spaces, public transport, shopping centres and health care facilities), and an unemployment rate on-par or lower in comparison to the state average (as determined by the Department of Jobs and Small Business, March Quarter 2019 release).