Affordable & Liveable Property Guide 2nd Half 2018
The PRD Affordable and Liveable Property Guides 2nd Half 2018 have just been released for Sydney, Melbourne, Brisbane, and Hobart. The reports provide valuable insight and highlights for the market, reporting on many key indicators, creating a holistic picture of property conditions in each capital city.
Surprises are in store for Affordable and Liveable property!
The PRD Affordable and Liveable Property Guides 2nd Half 2018 have just been released for Sydney, Melbourne, Brisbane, and Hobart. The reports provide valuable insight and highlights for the market, reporting on many key indicators, creating a holistic picture of property conditions in each capital city.
There were several surprises in the 2nd half of 2018 report, including:
- All affordable and liveable suburbs were in the north of
Brisbane. This was different to previous reports, where affordable and liveable
house hotspots were found in all pockets of Brisbane (i.e. north, south, east,
etc.).
- For the first time since 2015 all the affordable and liveable
suburbs in Sydney had negative annual median price growth, a sign of market
cooling. Prior to this, affordable and liveable suburbs showcased positive
growth, thus, in this report it became a task of nominating suburbs with as
moderate a softening as possible.
- None of the affordable suburbs in Hobart were able to
satisfy the liveability criteria. To ensure liveability aspects were met, the
median suburb price had to be raised above that of the Hobart metro median
price. This only occurred in Hobart, which suggests the strong need to develop
a strategy that addresses liveability aspects in more affordable areas of
Hobart.
- For the first time since 2016 the first and lowest price
band of $0-$500,000 has opened to Sydney buyers, at 1.4% of the market.
Although this is a very marginal part of the market, this marks a more
affordable Sydney.
- Of all the capital cities, Melbourne has proven to be the most resilient market, both in terms of price growth (in comparison to Sydney) and in ease of satisfying liveability aspects in its more affordable suburbs.
Affordable & Liveable Suburbs
Table 1 Illustrates liveability costs between the capital cities, with Hobart proving to have the highest average liveability cost at 12%, and Sydney and Brisbane taking out the title for most liveable cities with an average liveability cost of 3%.
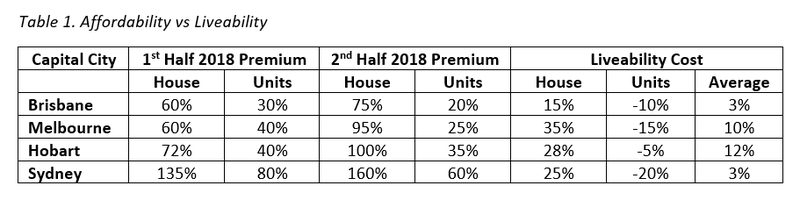 It is important to note that these premium percentages are
affected by median price movements in the market, and that unit markets in
Sydney, Melbourne, and Brisbane have experienced an annual softening. If only
based on house premium percentage, Melbourne becomes the most expensive city to
live in, followed by Hobart. This is quite surprising as for several years
Melbourne has been nominated as one of the most liveable cities in the
world.
It is important to note that these premium percentages are
affected by median price movements in the market, and that unit markets in
Sydney, Melbourne, and Brisbane have experienced an annual softening. If only
based on house premium percentage, Melbourne becomes the most expensive city to
live in, followed by Hobart. This is quite surprising as for several years
Melbourne has been nominated as one of the most liveable cities in the
world.
First home buyer activity continues to be a focal point in the 2018 property market. Table 2 confirms declining affordability over the past 12 months, particularly in Melbourne and Hobart, with drastic reductions in access to the first and lowest price band within each market. In Melbourne, access to the under $500K market shrunk significantly from 11.2% to 1.4%, whereas in Hobart access to the under $350K market declined from 28.6% to 8.2% in the 1st half of 2018.
Interestingly, Brisbane and Sydney have come out as the beacons of hope for those looking for affordability, with access to the less than $500K price bracket increasing. For Brisbane this increased from 10.6% in the 2nd half of 2017 to 12.4% in the 2nd half of 2018. The 2nd half of 2018 marks a momentous occasion for Sydney, as for the first time since 2016 buyers will be able to access the less than $500K market, albeit at the smallest percentage across capital cities at 1.4%.
The premium market, above the $2M price tag, has
decreased in sales activity in Brisbane Sydney and Melbourne, with the price
bracket completely vanishing in Brisbane. Interestingly the highest premium
market for Hobart, $800K+, has tripled from 3.6% to 10.2% over the past 12
months. This suggests that there may be a concentrated shift in buyer
activities across capital cities, creating more affordability in Brisbane,
Sydney and Melbourne, and causing price hikes in Hobart. Although this has been
an occurring pattern over the past 12 months now we are seeing the definite
results of this activity. Hobart is the only capital city in which the
percentage premium added to its affordable and liveable suburbs had to be above
what was added to reach the Hobart median price, thus, now is the time to
strategically re-think development in Hobart and its surrounding areas.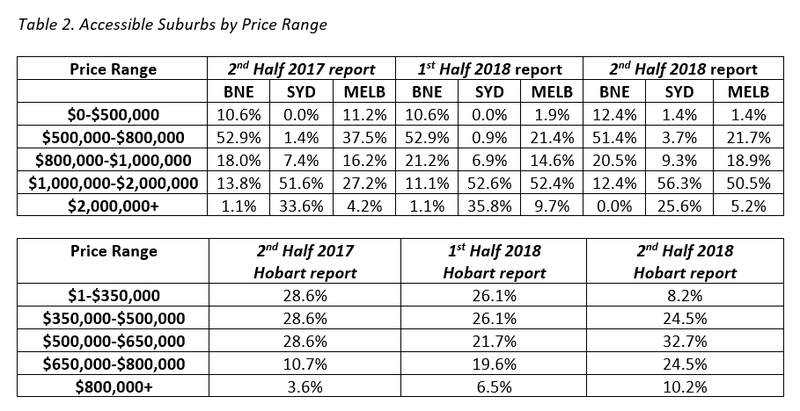
The PRD Affordable and Liveable Property Guides 2nd Half 2018 aim to identify affordable and liveable suburbs within 20km from each capital city’s CBD.
Considering all methodology criteria (property
trends, investment potential, affordability, project development, and
liveability factors), Table 3 identifies key suburbs that property watchers
should look out for.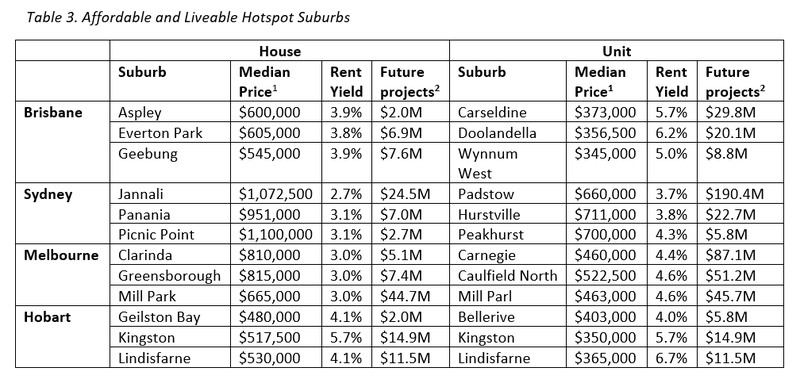
Table 3 highlights in general that Sydney has the highest entry price yet the lowest rental yield. In saying that, the Sydney house rental yield is comparable to that of Melbourne, potentially due to a softening in Sydney median house prices. This is good news for investors, given the past 24 months house rental yields in Sydney have been one of the lowest across all capital cities.
In the 1st half of 2018 Hobart
provided the lowest entry price with the highest rental yield; however, this is
no longer the case. Whilst it might be true for houses, both Brisbane and
Hobart compete for the title of most affordable, with the highest rental yield
for units. This is due to the softening in the Brisbane unit market, as well as
the upswing in the Hobart unit market.
Methodology
- Each PRD
Affordable and Liveable Property Guide focuses on suburbs within a 20km
radius of the CBD, taking into consideration the following factors:
- Property trends – all suburbs considered will have a minimum
of 20 transactions for statistical reliability purposes, with positive price
growth from 2017 to 2018.
- Investment – as of June 2018 the suburb will have an
on-par or higher rental yield than Melbourne Metro, and an on-par or lower
vacancy rate.
- Affordability – suburbs with a median price below the maximum
sale price of state average home loan plus allocated premium percentage. The
premium percentage added for a hotspot suburb must be below the premium
percentage added to purchase the relevant capital city median price.
- Project development – the suburb has a high total estimated
value of project development for the 2nd half of 2018. This ensures
sustainable economic growth, having a positive effect on the property market.
- Liveability factors – this includes ensuring low crime rate,
availability of amenities within a 5km radius (i.e. schools, green space,
public transport, shopping centres, and health care facilities), and an
unemployment rate on par or lower in comparison to the state average (as
determined by the Department of Jobs and Small Business, June Quarter 2018
release).
View the Capital City Guides


