Affordable & Liveable Property Guide 2nd Half 2019 - Adelaide
A key finding in this report is that most of the affordable and liveable suburbs are well spread out from the Adelaide CBD. These suburbs have the best possible median price growth, while also satisfying other criteria such as: low vacancy rates, high yields, large infrastructure spending, low crime and proximity to amenities. Adelaide also offers the most affordable housing when compared with all capital cities in Australia, which should encourage first home buyers to get into market.

Affordable
Suburbs
A key finding in this report is that most of the affordable and liveable suburbs are well spread out from the Adelaide CBD. These suburbs have the best possible median price growth, while also satisfying other criteria such as: low vacancy rates, high yields, large infrastructure spending, low crime and proximity to amenities. Adelaide also offers the most affordable housing when compared with all capital cities in Australia, which should encourage first home buyers to get into market.
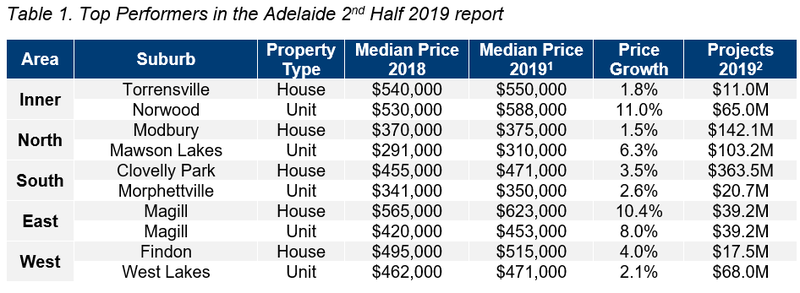
Adelaide Metro median house prices experienced growth of 0.5% to $475,000 from 2018 to 20191. Median unit prices also grew by 2.9% to $375,000 during the same period. Between 2018 to 20191 the number of sales transactions declined by -22.7% for houses and -15.7% for units. This indicates there is a potential undersupply in the market, which has led to positive median price growth. Table 1 highlights the top suburbs in Adelaide Metro based on price growth and total estimated value of projects commencing in 2nd Half 20192.
Housing affordability in South Australia3 (SA) has remained relatively stable, with the proportion of family income to meet loan repayments increasing by only 0.4% in the past 12 months. On another positive note, the number of first home buyers’ loans activity increased by 10.2% during the same period. SA is the only state to have reported this, making it a conducive environment for first home buyers.
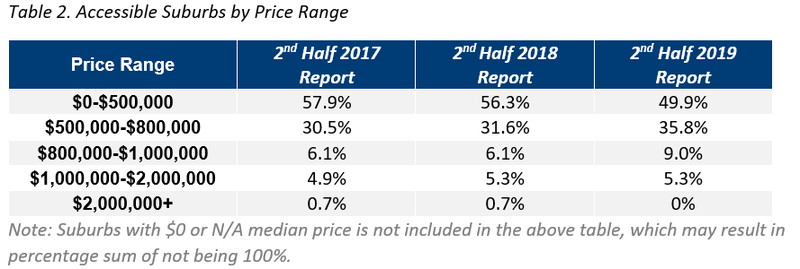
Table 2 provides the percentage of suburbs in Adelaide that are available for house buyers.
Liveable Suburbs
In the 12 months between 2nd Half 2018¥ and 2nd Half 2019 there have been some interesting shifts in Adelaide’s house price brackets. The proportion of sales in the lowest bracket of houses (below $500,000), has decreased from 56.3% to 49.9%, which is indicative of higher activity in the mid-price range and premium housing. This is in correlation with the Adelaide median house price growth of 0.5% in the 2nd Half 2019, which suggests that in contrast to other capital cities such as Brisbane, Sydney and Melbourne, Adelaide is moving upwards in pricing, and there are less options for those looking for highly affordable houses.
The dominant price point for Adelaide in the 2nd half of 2019 continues to be within the mid-range ($500,000-$800,000) bracket, which increased in the past 12 and 24 months. This is good news for homeowners in this price range, as they can be confident of a return on investment and high interest when selling.
Highly affordable suburbs (those with a maximum property sale price of the state average home loan3, plus a standard mortgage loan 20% deposit), do exist. There are 31 suburbs in this range, which suggests affordable property is available in Adelaide.
Adelaide provides high affordability for buyers, however some suburbs fail to meet either liveability, investment, and/or proposed development criteria. Premiums of 60% for houses and 0% for units needed to be added to the average SA average home loan3 in order identify suburbs which satisfy all other methodology criteria. There are 14 suburbs which have unit median prices lower than the SA average home loan3, which indicates great opportunities for buyers.
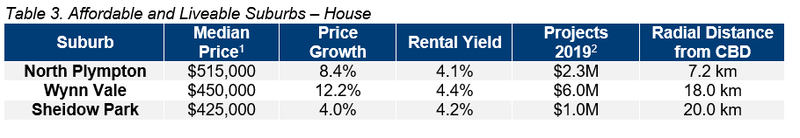
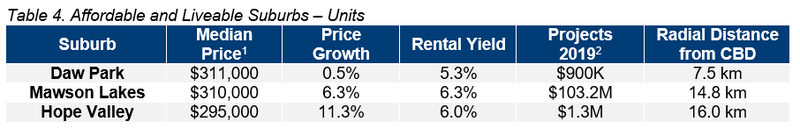
Considering all methodology criteria (property trends, investment, affordability, development, and liveability), Tables 3 and 4 identify key suburbs that property watchers should be on the lookout for.
Affordable & Liveable Suburbs
In the 12 months to Q2 2019, median rental prices4 increased by +2.9% for houses and +1.7% for units. Vacancy rates in Adelaide continue to decrease, in line with the increase in demand. Vacancy rates were recorded at 1.2% in June 2019, which is well below the Real Estate Institute of Australia’s healthy benchmark of 3.0%. This further indicates Adelaide has a healthy rental market, with investors benefiting from high occupancy rates. Adelaide Metro’s rental yields were 4.0% (houses) and 5.3% (units) in June 2019, which was well above Sydney Metro (houses 2.9% and units 3.8%) and Melbourne Metro (houses 3.0% and units 3.8%). With a lower median entry price compared with Sydney and Melbourne Metro, Adelaide is a more affordable and attractive investment area.
Over the 2nd half of 2019, Adelaide
is set to invest approximately $4.2B2 in new
development, with infrastructure accounting for the majority spending of $2.6B
(62.8%). This is followed by commercial projects ($701.7M, 16.7%) and
residential projects ($487.7M, 11.6%). A key infrastructure project being
constructed in the 2nd half of 2019 is the AIR555-1 and AIR7000 PH1B
($500M). This military project will deliver Piloted Aircraft System Sustainment
Facilities and will boost job opportunities in Adelaide and increase economic
activity in the area.
Methodology
This report analyses all suburbs in the Greater Adelaide area, within a 20km radius of the Adelaide CBD. The following criteria were considered:
- Property trends criteria – all suburbs have a minimum of 20 transactions for statistical reliability purposes. Based on market conditions, suburbs have either positive, or as close as possible to neutral price growth, between 2018 to 20191.
- Investment criteria – as of June 2019, all suburbs considered will have an on-par or higher rental yield than Adelaide Metro, and an on-par or lower vacancy rate.
- Affordability criteria – identified suburbs have a median price below a set threshold. This was determined by adding percentage premiums to the SA average home loan, which was $321,8424 as of the June quarter 2019. Premiums of 60% for houses and 0% for units were added, which for houses is well above the required to reach Adelaide Metro’s median prices (48%) and for units is below (17%). Unit suburbs identified are more affordable, but house buyers need to sacrifice on affordability to ensure liveability and/or investment potential.
- Development criteria – all suburbs identified within this report have a high total estimated value of future development for the 2nd half of 20192, as well as a higher proportion of commercial and infrastructure projects. This ensures suburbs chosen show signs of sustainable economic growth, which in turn has a positive effect on the property market.
- Liveability criteria – this included ensuring all suburbs assessed have low crime rates, availability of amenities within a 5km radius (i.e. schools, green spaces, public transport, shopping centres and health care facilities), and an unemployment rate on-par or lower in comparison to the state average (as determined by the Department of Jobs and Small Business, March Quarter 2019 release).December Quarter 2018 release).
PRD Affordable and Liveable Property Guide 2H 2019 - Adelaide


