Affordable & Liveable Property Guide 2nd Half 2019 - Melbourne
A key finding in this report is that most of the suburbs are spread across the north side of the Melbourne CBD. These suburbs have ticked the right boxes in relation to the best possible affordability, whilst also satisfying other criteria such as: low vacancy rates, high yields, large infrastructure spending, low crime and proximity to amenities. As Melbourne’s property market starts to head towards a recovery, there are ample affordable suburbs for first home buyers to take advantage of before prices start to surge.

Affordable Suburbs
A key finding in this report is that most of the suburbs are spread across the north side of the Melbourne CBD. These suburbs have ticked the right boxes in relation to the best possible affordability, whilst also satisfying other criteria such as: low vacancy rates, high yields, large infrastructure spending, low crime and proximity to amenities. As Melbourne’s property market starts to head towards a recovery, there are ample affordable suburbs for first home buyers to take advantage of before prices start to surge.
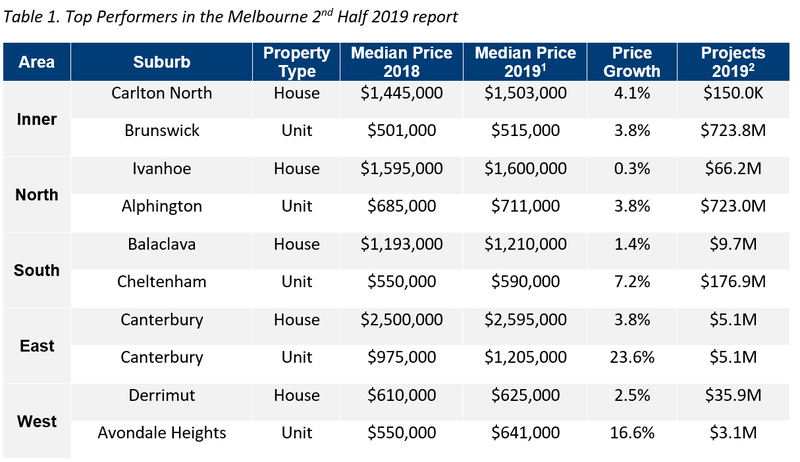
From 2018 to 20191, Melbourne Metro median house prices experienced a softening of -11.1%. The Melbourne Metro median unit price also softened, however at a lower rate of -1.9%. During this period the number of properties sold dropped by -33.8% (houses) and -39.3% (units). Melbourne properties have become more affordable with reduced competition in the market. Table 1 highlights top suburbs in the Melbourne Metro area based on price growth and total estimated value of projects commencing in 2nd Half 20192.
Housing affordability in Victoria (VIC) 3 has improved in the 12 months to the June quarter of 2019, with the proportion of income to meet home loan repayments declining by -5.2%. The number of first home buyers dropped by -5.7% during the same period, which suggests that first home buyer confidence is still recovering. New Federal Government incentives and the latest Reserve Bank of Australia’s cash rate cuts should lift first home buyer confidence for the rest of 2019 and into 2020.
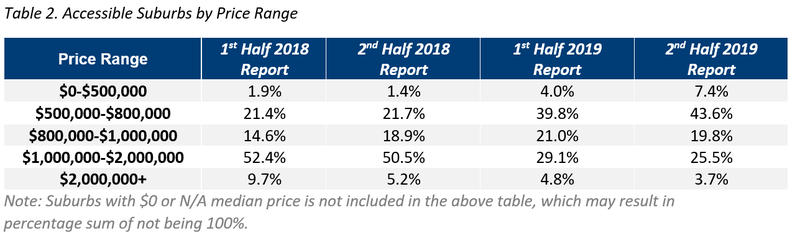
Table 2 provides the percentage of suburbs in Melbourne Metro that are available for house buyers.
Liveable Suburbs
In the 12 months between the 2nd half of 2018µ and the 2nd half of 2019, there has been a significant shift in price brackets for houses in Melbourne. The proportion of sales in the lowest bracket of houses (below $500,000) increased from 1.4% to 7.4%, which is indicative of first home buyers taking advantage of the cooling market conditions in Melbourne. Houses priced between $1,000,000 and $2,000,000 continue to decline in sales activity, from 50.5% to 25.5%, with sales transactions seemingly being distributed towards lower price points in the 2nd half of 2019.
The dominant price point for Melbourne in the 2nd half of 2019 continues to be within the $500,000 to $800,000 bracket, confirming strong affordability factors, especially when it has doubled from 21.7% in the 2nd half of 2018µ to 43.6% in the 2nd half of 2019. Overall, the current Melbourne median house price point distribution is good news for first home buyers, as there are more opportunities in the lower and middle range price points.
Affordable house suburbs (those with a maximum property sale price of the VIC state average home loan3, plus a 147% premium, as per the 1st Half 2019¥ report), include Yarraville, South Kingsville, Montmorency, Kingsville, Oakleigh East, Eltham and Mulgrave.
A cooling in Melbourne property prices has resulted in a higher number of affordable suburbs in the 1st Half 2019¥ report. However, there were many suburbs with negative price growth and many failing to meet the investment and/or liveability criteria. In line with the set methodology, suburbs with price growth as close as possible to neutral (i.e. zero) were chosen.
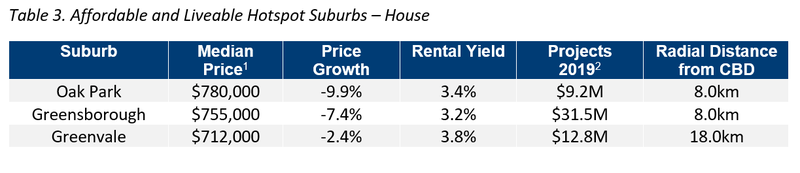
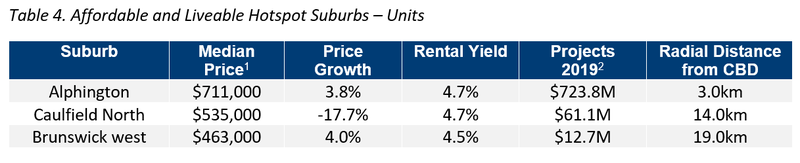
Considering all methodology criteria (property trends, investment, affordability, development, and liveability), Tables 3 and 4 identify key suburbs that property watchers should be on the lookout for.
Affordable & Liveable Suburbs
In the 12 months to Q2 2019, median rental prices4 have increased by +1.3% for houses and +3.6% for units. This correlates with softer median sales prices and transaction numbers, with more people choosing to rent. Vacancy rates continue to improve and were recorded at a resilient 2.0% in June 2019, well below the Real Estate Institute of Australia’s healthy benchmark of 3.0%. This indicates that the Melbourne rental market is performing at a strong level and is supported by high population growth. Melbourne recorded rental yields of 3.0% (houses) and 4.1% (units), which was above Sydney Metro (houses 2.9% and units 3.8%).
The 2nd half of 2019 is set to see $28.1B2 worth of development, with commercial and mixed-use projects being the focus. Melbourne South East International Airport is the main commercial project ($7.0B), with an additional airport runway which will increase productivity in the area. West Side Place Apartments/ Ritz Carlton Hotel ($500.0M) is a mixed-use project which will have 1519 apartments and retail space.
Methodology
This report analyses all suburbs in the Greater Melbourne area, within a 20km radius of the Melbourne CBD. The following criteria were considered:
- Property trends criteria – all suburbs have a minimum of 20 transactions for statistical reliability purposes. Based on market conditions, suburbs have either positive, or as close as possible to neutral price growth between 2018 to 20191.
- Investment criteria – as of June 2019, all suburbs considered will have an on-par or higher rental yield than Melbourne Metro, and an on-par or lower vacancy rate.
- Affordability criteria – identified suburbs have a median price below a set threshold. This was determined by adding percentage premiums to the VIC average home loan, which was $412,0493 as of the June quarter of 2019. Premiums of 90% for houses and 73% for units were added, which were below those required to reach Melbourne Metro’s median prices (198% for houses and 165% for units). This places the suburbs below Melbourne’s median prices, meaning that the suburbs identified within this report are more affordable for buyers.
- Development criteria – all suburbs identified within this report have a high total estimated value of future development for the 2nd half of 20192, as well as a higher proportion of commercial and infrastructure projects. This ensures suburbs chosen show signs of sustainable economic growth, which in turn has a positive effect on the property market.
- Liveability criteria – this included ensuring all suburbs assessed have low crime rates, availability of amenities within a 5km radius (i.e. schools, green spaces, public transport, shopping centres and health care facilities), and an unemployment rate on-par or lower in comparison to the state average (as determined by the Department of Jobs and Small Business, March Quarter 2019 release).
PRD Affordable and Liveable Property Guide 2H 2019 - Melbourne


