Affordable & Liveable Property Guide 2nd Half 2019 - National
The PRD Affordable and Liveable Property Guides 2nd Half 2019 are available for Sydney, Melbourne, Brisbane, Adelaide, Canberra, Perth and Hobart. These guides provide valuable insights and highlights of the market and report on many key indicators to create a holistic picture of property conditions in each capital city.

The PRD Affordable
and Liveable Property Guides 2nd Half 2019 are available
for Sydney, Melbourne, Brisbane, Adelaide, Canberra, Perth and Hobart. These
guides provide valuable insights and highlights of the market and report on
many key indicators to create a holistic picture of property conditions in each
capital city.
There were several surprise findings in the 2nd Half 2019 report:
- Almost all affordable and liveable suburbs identified in Brisbane were found solely on the northside. This contrasts with the 1st Half 2019¥ report, where affordable and liveable suburbs were found across different parts of Brisbane. Other affordable and liveable suburbs in different capital cities were spread geographically, thus only residents of Brisbane were restricted in choice of affordable and liveable suburbs.
- Many capital cities experienced market cooling between 2018 and 20191, which meant many suburbs recorded negative growth. This resulted in a slight adaptation of the methodology set, whereby suburbs with price growth as close as possible to neutral (i.e. zero) were considered in choosing affordable and liveable suburbs. This was the case for Sydney, Melbourne, Perth, Canberra, and Hobart. For Sydney, this has been the case since the 2nd Half 2018µ report, which is good news for first home buyers.
- None of the affordable suburbs in Hobart, Perth, Adelaide, or Canberra were able to satisfy either the liveability and/or investment criteria. To ensure liveability and/or investment aspects were met, the premium percentage added to the respective state average home loan3 had to be higher than the required premium percentage, in order to reach the respective capital city metro median price. This suggests that residents of Hobart, Perth, Adelaide and Canberra need to sacrifice on affordability to ensure liveability and/or investment potential.
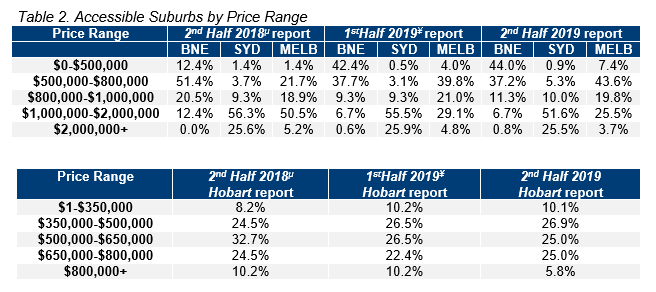
- Due to a market cooling in some capital cities, the percentage of houses available in the lowest price range bracket (below $500,000 for all capital cities except for Hobart, which was $350,000) increased. This is the case for Melbourne, Brisbane and Hobart, however not for Adelaide and Sydney.
Liveable Suburbs - National
Table 1 illustrates the different premium percentages added to the state average home loan3 for each capital city, between the required premium percentage to reach the respective capital city metro median price, and the premium percentage required to identify suburbs which met all criteria (liveability, investment, and project development).
The cost of liveability is the highest in Perth, as a high premium percentage had to be added to the state average home loan3 for both houses and units. This was significantly higher than the required premium percentage to reach Perth Metro’s median price. Table 1 also highlights the difficulty in finding unit suburbs which satisfy both affordable and liveable criteria, with premiums higher than capital city median prices added. In terms of premium difference, Melbourne has the most affordable liveability which is good news for residents. From the perspective of the average premium percentage added to find affordable and liveable suburbs, Adelaide is the least expensive (30%), while Hobart is the most expensive (108%).
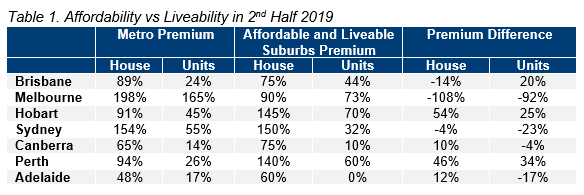
It is important to note that these premium percentages are affected by two key variables: median price movements in the market, and the ability of a suburb to meet the liveable criteria. For example, in Hobart, Perth, Adelaide and Canberra, the premium percentages added (to the respective state average home loan3) were higher than the required premium percentages to reach each of the capital city’s median prices. This is interesting, particularly for Hobart and Adelaide, as they are historically known as affordable capital cities. This points to an urgent need to address infrastructure and commercial activity in the area, to increase liveable aspects for residents.
First home buyer activity continues to be a focal point in the 2019 property market. Table 2 suggests there is increasing hope for first home buyers, particularly in Melbourne, Brisbane and Hobart. The lowest price range (of less than $500,000 in Melbourne and Brisbane and less than $350,000 in Hobart), has truly opened for first home buyers. Now is an ideal time for first home buyers in these capital cities to enter the market.
Considering all methodology criteria (property trends, investment potential, affordability, project development, and liveability factors), Table 3 identifies key affordable and liveable suburbs which property watchers should look out for in 2020.
Affordable & Liveable Suburbs - National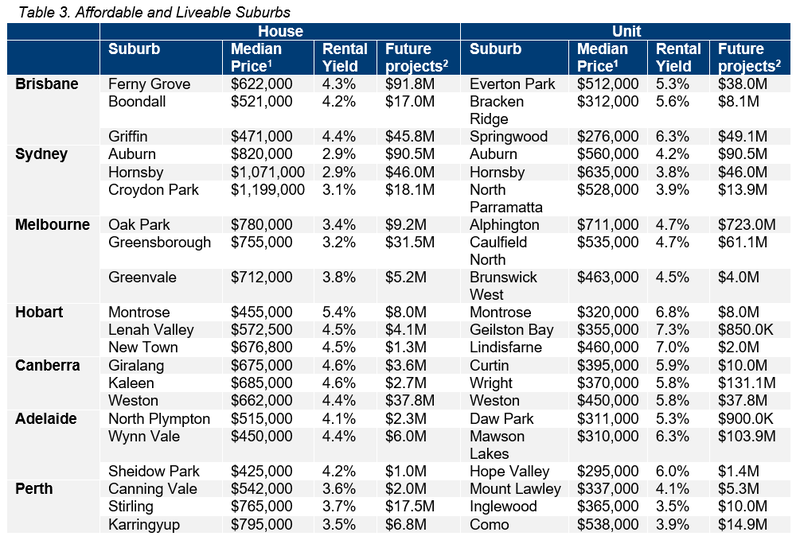
After
looking at the affordable and liveable suburbs identified in Table 3, it is
evident that in general, Sydney and Melbourne have the highest entry prices,
yet the lowest rental yields. This is a similar pattern to the 1st Half 2019¥ report,
despite a market cooling. Hobart median prices are now on par with Brisbane,
which suggests affordability has declined in Hobart. The most affordable
capital city is Adelaide, giving home buyers and investors most “bang for
buck”, due to it having the lowest median prices and highest rental yield. It
is no wonder that South Australia (SA) was the only state to have recorded
positive growth in first home buyer3 loans in the 12 months to Q2
2019.
Methodology
Each report focuses on suburbs within a 20km radius of the CBD (or 10km for Hobart and Canberra), taking into consideration the following criteria:
- Property trends criteria – all suburbs have a minimum of 20 transactions (or 10 transactions for Hobart and Canberra) for statistical reliability purposes. Based on market conditions, suburbs have either positive, or as close as possible to neutral price growth between 2018 to 20191.
- Investment criteria – as of June 2019, all suburbs considered will have an on-par or higher rental yield than the relevant Capital City Metro area, and an on-par or lower vacancy rate.
- Affordability criteria – identified suburbs have a median price below a set threshold. This threshold was set by adding a percentage premium to the respective state’s average home loan3. This percentage premium must result in a price threshold below the capital city’s median price in order to ensure affordability.
- Development criteria – all suburbs reviewed have a high total estimated value of project development for the 2nd half of 2019, as well as a higher proportion of commercial and infrastructure projects. This ensures sustainable economic growth, which in turn has a positive effect on the property market.
- Liveability criteria – all suburbs assessed must have a low crime rate, availability of amenities within a 5km radius (i.e. schools, green spaces, public transport, shopping centres, and health care facilities), and an unemployment rate on-par or lower in comparison to the state average (as determined by the Department of Jobs and Small Business, March Quarter 2019 release).
View all the Affordable and Liveable Property Guides 2nd Half 2019
- Affordable & Liveable Property Guide 2nd Half 2019 - Adelaide
- Affordable & Liveable Property Guide 2nd Half 2019 - Brisbane
- Affordable & Liveable Property Guide 2nd Half 2019 - Canberra
- Affordable & Liveable Property Guide 2nd Half 2019 - Hobart
- Affordable & Liveable Property Guide 2nd Half 2019 - Melbourne
- Affordable & Liveable Property Guide 2nd Half 2019 - Perth
- Affordable & Liveable Property Guide 2nd Half 2019 - Sydney