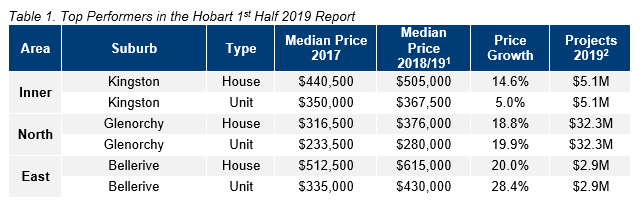
Hobart - Affordable & Liveable Property Guide 1st Half 2019
Median property prices in Hobart grew by 1.7% (houses) to $450,000 and 4.0% (units) to $340,000 between 2017 and 2018. During this time sales transactions softened by -41.1% (houses) and -50.3% (units), indicating that price increases were due to scarcity of stock. Compared to the 10.6% (houses) and 7.2% (units), median price growth quoted in the Hobart Affordable and Liveable Property Guide 1st Half 2018, this signals that the market is starting to return to a more sustainable level of price growth. This is great news for first home buyers, as they have been priced out of the market for the past 12 months by interstate investors.
The median house price in Hobart grew by 12.4% to reach $529,500 in 2018/20191, whilst the median unit price softened by -5.9% to $399,500 over the same period. Sales transactions increased for both houses and units over this same time frame, by 5.1% for houses and 8.2% for units, which indicates there is a high demand in the market. In regard to price growth, there was a correction in the unit market’s pricing, however a continued trend of increasing sales volumes will potentially provide enough underlying demand to lead a unit market recovery into the future.
Hobart’s house market continues to strengthen, and as this contrasts with many other capital cities, it should increase current owner occupiers’ and investor’s confidence.
Affordable Suburbs - Hobart
In the 2nd Half 2018¥ report there were no highly liveable suburbs that met the affordable criteria of having a maximum sale price below the average home loan in Tasmania (TAS), plus the premium of 69% for houses and 27% for units that needed to be added to purchase at the Hobart Metro median price.
This
is a continued finding in the 1st
Half 2019 report, as premiums of 120% for houses and 60% for units were added to
the average TAS home loan to allow for selecting suburbs that meet the
liveability criteria of this report. This is above the premiums of 92% for
houses and 42% for units needed to purchase at the Hobart Metro median price,
which suggests that buyers in Hobart need to sacrifice affordability to ensure
liveability and/or investment aspects.
Over the 12 months to Q4 2018, the proportion of income to meet home loan repayments decreased by 0.7% in TAS3. This suggests that home affordability for current mortgage owners increased, which is in contrast with other states such as Queensland and New South Wales. Further, this has had a multiplier effect on the market, with the number of first home buyers increasing by 12.6% in the same period3.
Table 2 provides the percentage of suburbs in Hobart that are available for house buyers across various price ranges.
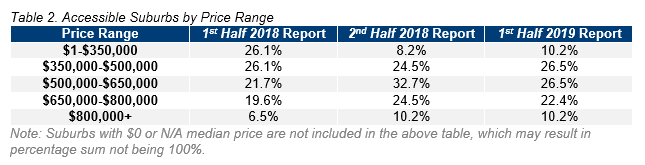
Affordable options in Hobart continue to diminish, with houses
priced below $350,000 declining significantly since the 1st Half 2018µ report to now, from 26.1% to
10.2%. This poses a great challenge for those seeking to enter the market for
the first time, as the most affordable options are quickly disappearing.
Looking even further back to the 1st
Half 2017π report, this represents an even bigger contraction in
affordable options over the past 2 years.
That said, there is an equal spread of sales transaction activity
in each price range between $350,000-$500,000, $500,000-$650,000, and $650,000-$800,000,
at 26.5%, 26.5%, and 22.4% respectively. This suggests that there is equal
opportunity for different budgets, which is good news as it shows the market is
still inclusive. The premium market of $800,000 and above has further increased
its market share, from 3.8% in the 1st
Half 2017π report to 6.5% in the 1st Half 2018µ report, and finally to 10.2%
in this report. This provides a golden opportunity for developers who are
looking to offer niche premium products to the market.
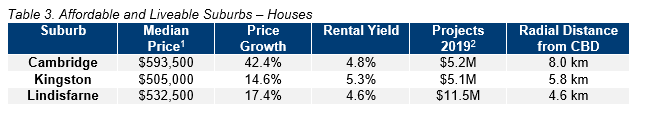
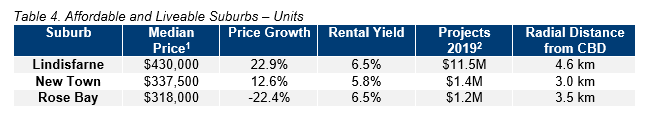
Highly affordable suburbs (those with a maximum property sale
price of the average state loan, plus a 100% premium as per the 2nd
Half 2018¥ report) exist. 23 suburbs recorded prices in this
bracket.
Despite their affordability, many of these suburbs fail to meet
liveability criteria. To achieve liveability, premiums of 120% for houses and
60% for units needed to be added to the TAS average state loan. Kingston (for
houses) and Lindisfarne (for houses and units) held onto their status as
affordable and liveable suburbs, as identified in the 2nd Half
2018¥ report. Other previously identified affordable and
liveable suburbs in Hobart have either failed to meet liveability criteria, or
have become unaffordable due to median price growth. This highlights the need
for increasing liveability aspects in affordable suburbs in Hobart.
Considering all methodology criteria (property trends, investment,
affordability, development, and liveability), Tables 3 and 4 identify key
suburbs that property watchers should be on the lookout for.
Across Q4 2018, Hobart recorded a median rental price of $410 per week for houses and $350 per week4 for units. This represents strong growth of 7.9% for houses and 9.4% for units in the 12 months to Q4 2018. Vacancy rates continue to remain very low, at just 0.4% across Hobart Metro in December 2018. Together, these factors suggest a highly competitive rental market for both houses and units and highlights an undersupply of available stock. This also partly explains its high rental yields, reaching 5.8% for houses and 5.9% for units in December 2018. Investors are therefore still able to achieve strong results within Hobart and should act while such positive results are still possible.
The
1st half of 2019 is set to see approximately $265.7M of development commence
in Hobart, with a major focus on infrastructure. There is healthy spending on
mixed-use, commercial, and residential developments. A key infrastructure
project is the $90.0M Macquarie Point Waterfront/Hobart Railyards
redevelopment. Another key project is Commons Hobart ($20.0M) which will add 30
apartments as well as commercial and retail spaces. The 84-lot, $3.7M,
Sugarloaf Road subdivision is the largest residential project commencing in the
period.
Methodology
This affordability and liveability property guide for Hobart analyses all suburbs in the Greater Hobart area, within a 10km radius of the Hobart CBD. The following criteria were considered:
- Property trends criteria – all suburbs considered have a minimum of 10 transactions for statistical reliability purposes, with positive price growth between 2017 to 2018/191.
- Investment criteria – as of December 2018, all suburbs considered will have an on-par or higher rental yield than Hobart Metro, and an on-par or lower vacancy rate.
- Affordability criteria – all identified suburbs required a median price below a set threshold. This was determined by adding percentage premiums to the Tasmania (TAS) average home loan, which was $275,2174 as of Q4 2018. Premiums of 120% for houses and 60% for units were added. These were above those required to reach Hobart metro’s median prices (92% for houses and 42% for units), which suggests that buyers in Hobart need to sacrifice affordability to ensure liveability and/or investment criteria.
- Development criteria – all suburbs reviewed have a high total estimated value of future project developments for the 1st half of 2019, as well as a higher proportion of commercial and infrastructure projects. This ensures suburbs chosen show signs of sustainable economic growth, which in turn has a positive effect on the property market.
- Liveability criteria – this included ensuring all suburbs assessed have low crime rates, availability of amenities within a 5km radius (i.e. schools, green spaces, public transport, shopping centres and health care facilities), and an unemployment rate on-par or lower in comparison to the state average (as determined by the Department of Jobs and Small Business, December Quarter 2018 release).
PRD Affordable and Liveable Property Guide 1st Half 2019 - Hobart


