Q1 2019 Key Market Indicators – Tasmania
The number of first home buyer loans approved in Tasmania (TAS) in the September quarter of 2018 was 483 loans, which is a significant 25.1% increase compared to the 12 months prior. This has earned TAS a gold award nationally in the PRD Q1 2019 Key Market Indicator Awards, for the most improved number of first home buyer loans. This confirms TAS as a haven for first home buyers, as it eclipses the 12-month growth to March quarter 2018 of 6.9%, and the June quarter 2018 of 20.5%.
Tasmania continues to be a haven for first home
buyers
The number of first home buyer loans approved in Tasmania (TAS) in the September quarter of 2018 was 483 loans, which is a significant 25.1% increase compared to the 12 months prior. This has earned TAS a gold award nationally in the PRD Q1 2019 Key Market Indicator Awards, for the most improved number of first home buyer loans. This confirms TAS as a haven for first home buyers, as it eclipses the 12-month growth to March quarter 2018 of 6.9%, and the June quarter 2018 of 20.5%.
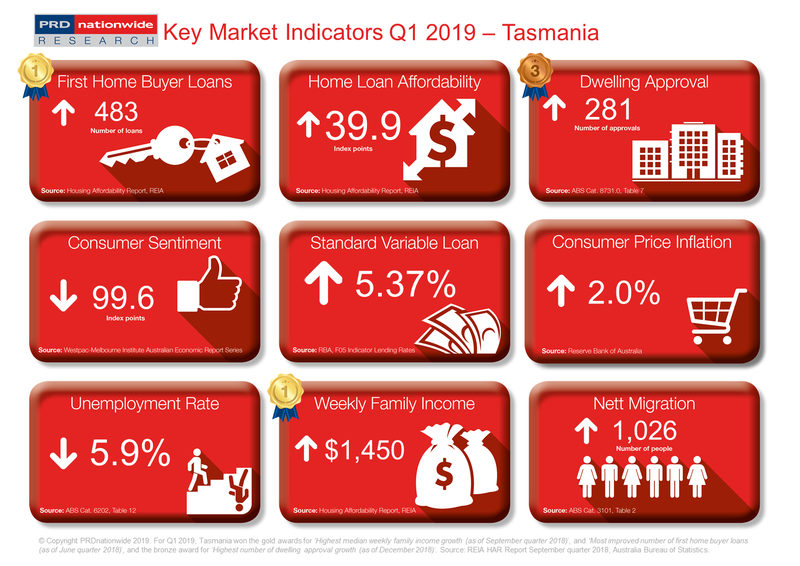
TAS takes a bronze award nationally for the highest dwelling approvals growth in the PRD Q1 2019 Key Market Indicator Awards. 281 dwelling approvals were passed in December 2018, which is a 10.6% increase since December 2017. This trend is in contrast with other states across Australia, such as New South Wales (-27.0%), Victoria (-24.7%), Queensland (-29.6%), and the Australian average of -24.7%, all of which saw a declining trend.
It makes sense for TAS to be passing a high number of dwelling approvals, considering it is still a hotspot for interstate investors. Hobart, for example, recorded a median house price of $450,000 in 2018, signifying a 1.7% annual growth. The median unit price in Hobart was $340,000 in 2018, representing a 4.0% annual growth. This contrasts with Sydney Metro’s median house price in 2018 of $1,275,000, which signified a softening of -5.6% over the previous 12 months. The median unit price in Sydney Metro was $765,000 in 2018, signifying a softening of -2.6%. Thus, not only are prices lower in Hobart, they also represent growth.
The increase in dwelling approvals is also needed to satisfy local demand, as nett migration to TAS has increased by 62.9% over the past 12 months (between June 2017-2018). Developers should work with local government authorities to increase supply, to avoid higher property prices in the near future.
The PRD Q1 2019 Key Economic Indicators provide consumers with a quick snapshot of the current state of the market in Australia, from both an economic and property perspective. The Indicators cover both national and state level data, comprising of:
- Number of loans to first home buyers
- Home loan affordability index
- Number of dwelling approvals
- Consumer sentiment index
- Standard variable loan
- Consumer price inflation index
- Unemployment rate
- Weekly family income
- Nett migration
View the Q1 2019 Key Market Indicators


