Q2 2019 Key Market Indicators – Australian Capital Territory
The Australian Capital Territory (ACT) continues to perform in the PRD Q1 2019 Key Market Indicator Awards; earning 4 gold, 1 silver, and 1 bronze award nationally. The ACT has once again earned the gold award nationally for the highest home loan affordability index reading, at 50.0 index points in the September quarter of 2018. This is a 4.4% increase within a 12-month period, previously at 47.9% in the June quarter of 2018.
Strong Economic Fundamentals In The Australia Capital Territory Set The Scene For A Bright Future
The Australian Capital Territory (ACT) continues to showcase strength with solid economic fundamentals, earning it a silver award nationally in the ‘PRD Q2 2019 Key Market Indicator Awards’, for the lowest unemployment rate, and a gold award nationally for highest median weekly family income.
The ACT recorded a median weekly family income of $2,727 in the December quarter of 2018, which represented a 2.4% increase over the past 12 months. Although this is not the highest level of wage growth in Australia, it is on par with the Australian average of 2.6%, ensuring ACT’s strong economic fundamentals are sustainable in the long term.
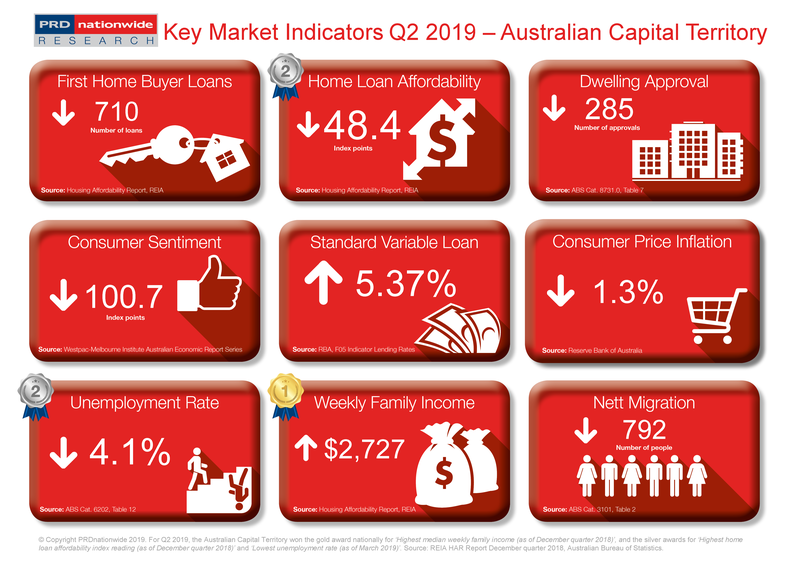
Those working in the ACT have significantly higher purchasing power than those in other states, as the ACT median weekly family income is 54.5% higher than the Australian average income. Furthermore, the unemployment rate in the ACT has declined over the past 12 months (to March 2019), by -2.4% to 4.1%. This the second lowest unemployment rate across all Australian states, the lowest being in the NT at 3.7%. This creates an extremely powerful customer base for developers to be able to identify niche opportunities for new products.
That said, dwelling approvals have declined significantly in the ACT by -35.8% over the past 12 months (to February 2019). This is not surprising as there has been high dwelling development activity in the ACT over the past 18-24 months, thus, it is time to allow for current and planned stock to be absorbed. Nett migration declined by -45.0% over the past 12 months (to September 2018) in the ACT, which will create less competition in the market and provide local first home buyers with a more level playing field. The discrepancy between dwelling approval and nett migration percentage decline should create an equilibrium between property demand and supply in the near future. This should soften the current property price growth in the ACT residential market, which will also assist first home buyers.
The ‘PRD Q2 2019 Key Market Indicators’ provide a quick snapshot of the current state of the market in Australia from both an economic and property perspective. The Indicators cover both national and state level data, comprising of:
- Number of loans to first home buyers
- Home loan affordability index
- Number of dwelling approvals
- Consumer sentiment index
- Standard variable loan
- Consumer price inflation index
- Unemployment rate
- Weekly family income
- Nett migration
View the Q2 2019 Key Market Indicators


