Q3 2019 Key Market Indicators – Northern Territory
The Northern Territory’s (NT) home loan affordability index reading was 49.6 index points in the March quarter of 2019, well above the Australian average of 33.0 index points. This establishes the NT as the most affordable state in Australia.
Northern Territory is the most affordable state in Australia
The Northern Territory’s (NT) home loan affordability index reading was 49.6 index points in the March quarter of 2019, well above the Australian average of 33.0 index points. This establishes the NT as the most affordable state in Australia, followed closely by the Australian Capital Territory with a home loan affordability index of 49.3 points. This is the second time the NT has taken the gold award nationally in the highest home loan affordability index reading category in the PRD Q3 2019 Key Market Indicator Awards. It previously won with a home loan affordability index reading of 51.5 points in the December quarter of 2018.
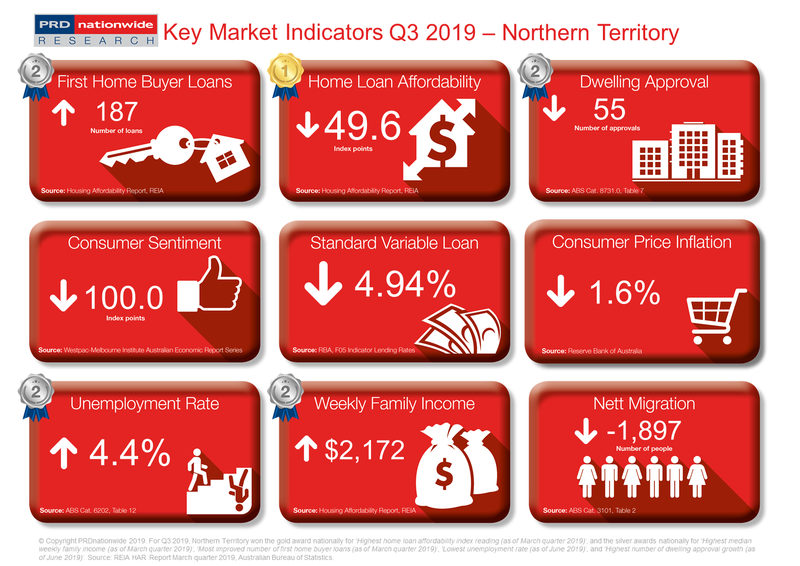
Not surprisingly, the number of first home buyers in the NT has
increased by 12.7% in the 12 months to the March quarter of 2019. This
contrasts with the -11.6% decline in the Australian average, which earned the
NT a silver award nationally in the most
improved number of first home buyer loans category. Similar to the home
loan affordability index pattern, this is the second time in the PRD 2019 Key Market Indicator Series that the
NT recorded a contrasting pattern to the Australian average. In the 12 months
to the December quarter of 2018, the NT recorded an increase of 24.3%, while the
Australian average declined by -5.8%.
The NT has demonstrated strong economic fundamentals for the rest of 2019, earning silver awards nationally in the lowest unemployment rate and highest median weekly family income growth categories. The unemployment rate in the NT was 4.4% in June 2019, which although increased by 1.6% in the past 12 months, is still a much lower rate than the Australian average of 5.2%. The median weekly family income was $2,172 in the March quarter of 2019, representing a 2.5% increase in the past 12 months (in line with the Australian average increase of 2.7%). From a property perspective, this suggests a potential increase in the number of home buyers and investors.
The PRD Q3 2019 Key Market Indicators provide a quick snapshot of the current state of the market in Australia from both an economic and property perspective. The Indicators cover both national and state level data, comprising of:
- Number of loans to first home buyers
- Home loan affordability index
- Number of dwelling approvals
- Consumer sentiment index
- Standard variable loan
- Consumer price inflation index
- Unemployment rate
- Weekly family income
- Nett migration


