Q4 2018 Key Market Indicators – South Australia
South Australia (SA) recorded 37.0 points in the home loan affordability index in the June quarter of 2018, signifying a decline of -0.8% over the past 12 months. That said, this is the second least decline across the country, just below New South Wales at 0.0%. This suggests that in terms of home loan affordability growth, SA is the second highest state, making it a top performer. Furthermore, SA’s home loan affordability index reading is much higher than Australia’s 31.1 points, confirming SA as an attractive option for interstate property investment.
South Australia is the second most affordable
state in Australia
South
Australia (SA) recorded 37.0 points in the home loan affordability index in the
June quarter of 2018, signifying a decline of -0.8% over the past 12 months.
That said, this is the second least decline across the country, just below New
South Wales at 0.0%. This suggests that in terms of home loan affordability
growth, SA is the second highest state, making it a top performer. Furthermore,
SA’s home loan affordability index reading is much higher than Australia’s 31.1
points, confirming SA as an attractive option for interstate property
investment.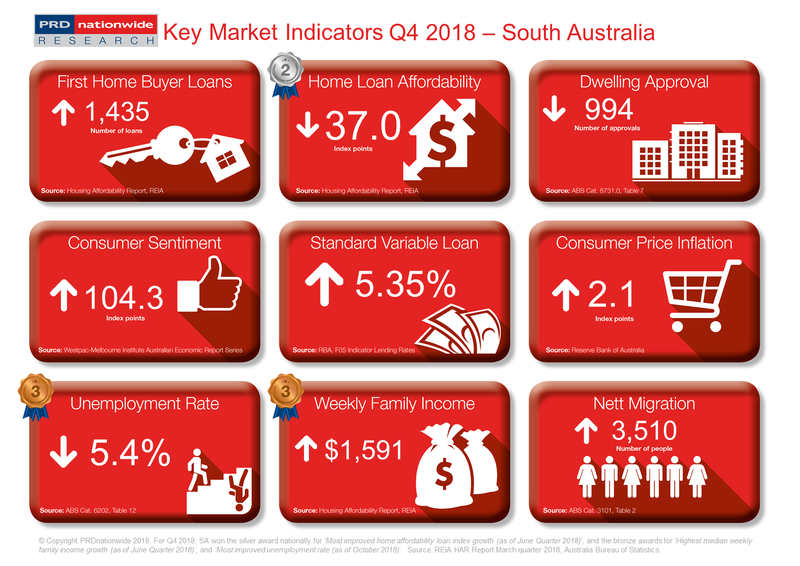 Coincidentally, more Australians are choosing to live in SA,
with nett migration increasing by a significant 28.3% over the past 12 months
to March 2018. Yet dwelling approvals in SA have declined by -8.2% over the
past 12 months to September 2018, suggesting that there may be an undersupply
in the near future. This could potentially see property prices increase, thus,
the SA state government needs to work with property developers to create a
strategy that will ensure enough stock are created to cater for the increasing
population.
Coincidentally, more Australians are choosing to live in SA,
with nett migration increasing by a significant 28.3% over the past 12 months
to March 2018. Yet dwelling approvals in SA have declined by -8.2% over the
past 12 months to September 2018, suggesting that there may be an undersupply
in the near future. This could potentially see property prices increase, thus,
the SA state government needs to work with property developers to create a
strategy that will ensure enough stock are created to cater for the increasing
population.
The number of first home buyers in SA improved by 5.7% over the past 12 months to the June quarter of 2018 which, although still positive, is a decline from the 7.5% growth reported between the March quarter 2017-2018.
That said, first home buyers in SA can draw comfort from the -6.9% decline in unemployment rates over the past 12 months to June 2018, which resulted in a bronze medal nationally in the most improved unemployment rate. This is further supported by a bronze medal nationally in the highest median weekly family income growth category, recording an increase of 2.4% in median weekly family income over the past 12 months to the March quarter of 2018. Combined, these two key indicators create strong economic fundamentals in SA, which should assist in the purchase of more homes in 2019.
The
PRD Q4 2018 Key Market Indicators provide a quick snapshot of the
current state of the market in Australia from both an economic and property
perspective. The Indicators cover both national and state level data,
comprising of:
- Number
of loans to first home buyers
- Home
loan affordability index
- Number
of dwelling approvals
- Consumer
sentiment index
- Standard
variable loan
- Consumer
price inflation index
- Unemployment
rate
- Weekly
family income
- Nett
migration
View the Q4 2018 Key Market Indicators


