Q4 2019 Key Market Indicators – Northern Territory
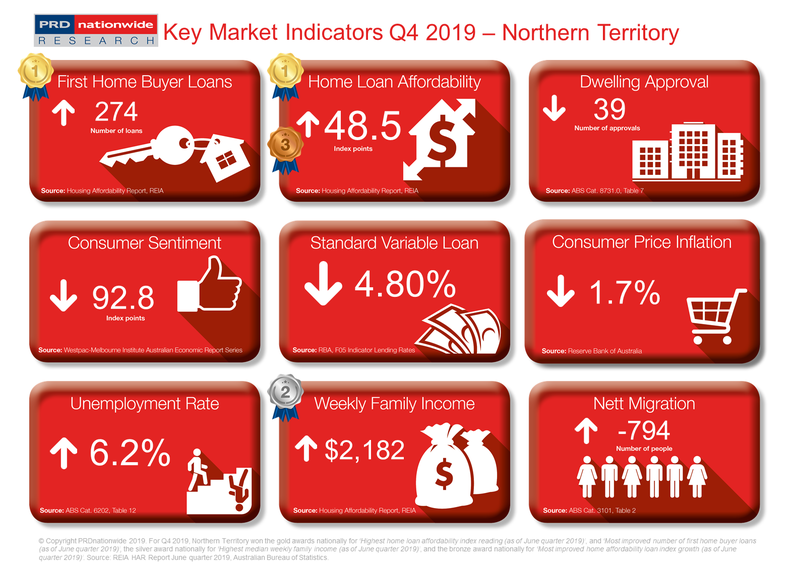
The Northern Territory (NT) recorded 274 new first home buyer loans in the June quarter of 2019. Although this number may seem small, it is actually a 54.8% improvement compared with the 177 first home buyer loans recorded in the June quarter of 2018. This has earned the NT a gold award nationally for the Most Improved Number of First Home Buyer Loans.

First home buyers flock to the Northern Territory
The Northern Territory (NT) recorded 274 new first home buyer loans in the June quarter of 2019. Although this number may seem small, it is actually a 54.8% improvement compared with the 177 first home buyer loans recorded in the June quarter of 2018. This has earned the NT a gold award nationally for the Most Improved Number of First Home Buyer Loans category in the PRD Q4 2019 Key Market Indicator Awards. This suggests there are ample opportunities for those looking to enter the NT property market.

The increase in first home buyer activity in the NT is
not surprising, considering its home loan affordability index reading in the June
quarter of 2019 was 48.5 points, earning it a silver award nationally in the Highest Home Loan Affordability Index Reading
category. This represents a
4.5% growth in the past 12 months, higher than the Australian average growth of
3.5%. This positions NT as a highly affordable state, especially in comparison
to historically affordable states such as South Australia and Tasmania, whose
home loan affordability index reading worsened in the past 12 months.
Nett migration in the NT declined by -10.0% in the 12 months to the March quarter of 2019, and with a lower population than other states, there is less competition in the market. This worked well for local first home buyers, in terms of driving property prices down and providing them with an equal playing field in the market, which contrasts with most states in Australia.
Economic fundamentals are quite unique
in the NT, as although the unemployment rate increased significantly from 4.1%
in September 2018 to 6.2% in September 2019, median weekly family income
increased by 2.5% in the 12 months to the June quarter of 2019. Those working
can enjoy a higher disposable income, however there is an urgent need to
address local job creation. This combination
creates a volatile economy, with an
unpredictable spill-over impact on the property market.
The
PRD Q4 2019 Key Market Indicators report provides a quick snapshot of the
current state of the market in Australia from both an economic and property
perspective. The Indicators cover both national and state level data,
comprising of:
- Number of loans to first home buyers
- Home loan affordability index
- Number of dwelling approvals
- Consumer sentiment index
- Standard variable loan
- Consumer price inflation index
- Unemployment rate
- Weekly family income
- Nett migration
View all Q4 2019 Key Market Indicators


