Melbourne - Affordable & Liveable Property Guide 1st Half 2019
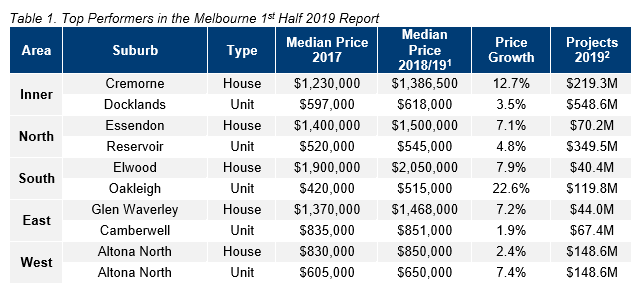
The Melbourne Metro house median price slightly softened by -0.4% between 2017 and 2018/20191, whereas the median unit price remained resilient, growing by 1.7% during the same time frame. Although a softening in the housing market was predicted, further growth in the unit market was not. Affordable house and unit options can be found in the north, south and east of Melbourne Metro, which opens the market up to more first home buyers.

Affordable Suburbs - Melbourne
The Melbourne Metro house median price slightly softened by -0.4% between 2017 and 2018/20191, whereas the median unit price remained resilient, growing by 1.7% during the same time frame. Although a softening in the housing market was predicted, further growth in the unit market was not. Affordable house and unit options can be found in the north, south and east of Melbourne Metro, which opens the market up to more first home buyers.
Over the past 12 months (to the December 2018 quarter3), affordability in Victoria (VIC) has increased. This contrasts with other states, particularly in Queensland and New South Wales, where housing affordability has declined. In VIC, the proportion of family income to meet loan repayments decreased by 33.1%3. Further, the number of first home buyers’ loans have increased by 2.7%3.
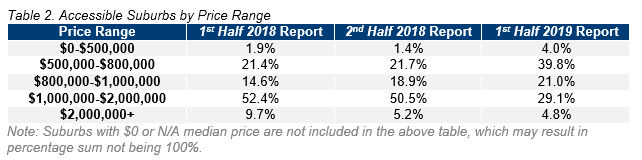
Table 2 provides the percentage of suburbs in Melbourne that are available for house buyers across various price ranges.
Liveable Suburbs - Melbourne
In the 12 months between the 1st Half 2018µ and 1st Half 2019 reports there have been some significant shifts in price brackets for houses in Melbourne. The proportion of sales in the lowest bracket of houses (below $500,000) have increased from 1.9% to 4.0%, a price point shift that has not occurred over the past 3 years. The $1,000,000-$2,000,000 range is no longer the dominant price point, and has declined in sales activity from 52.4% to 29.1% over the same period. Sales transactions have seemingly been distributed towards lower price points in the 1st Half 2019 report.
The dominant price point for Melbourne in the 1st Half 2019 report is now the $500,000-$800,000 bracket, confirming a shift towards increased affordability. This is not surprising, considering there has been a cooling in property prices over the past 12 months, and uncertainties in the market. Overall, the current Melbourne price point distribution is good for first home buyers, as it has opened more opportunities and caters for a wider range of budgets.
Affordable house suburbs (those with a maximum property sale price of the VIC average state loan, plus a 40% premium as per the 2nd Half 2018¥ report) still exist. This includes suburbs such as: Delahey, Broadmeadows, Campbellfield, Albanvale, Kings Park, Jacana, and Coolaroo. However, these suburbs fail to meet the liveability criteria set.
To meet both affordable and liveable criteria, a premium of 147% for houses and 42% for units needed to be added to the VIC state average home loan. Caulfield North and Mill Park were identified as affordable and liveable suburbs in the 2nd Half 2018¥ report, however as they have experienced high price growth over the past 6 months they are no longer considered affordable.
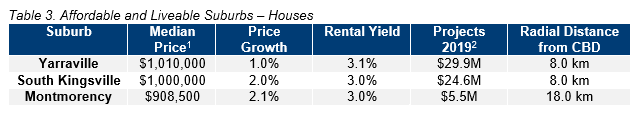
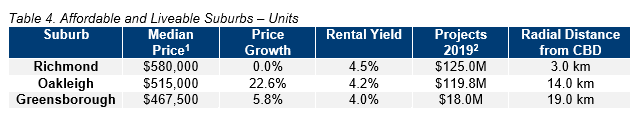
Considering
all methodology criteria (property trends, investment, affordability,
development, and liveability), Tables 3 and 4 identify key suburbs that
property watchers should be on the lookout for.
Affordable & Liveable Suburbs - Melbourne
Over the 12 months to Q4 2018, Melbourne’s rental market recorded median rental price growth of 1.3% to reach $400 per week4 for houses and 2.4% $430 per week4 for units. This is unique, as other capital cities have either experienced stable or declining rental growth. Investors are benefiting from great rental returns of 3.0% for houses and 4.0% for units. As of December 2018, the Melbourne Metro vacancy rate was at a healthy 2.1%. This is below the combined capital cities vacancy rate of 2.6%, indicating a healthier rental market demand. This provides investors assurance that their rental property will be occupied relatively quickly.
The 1st half of 2019 is set to see approximately $14.2B worth of projects commence in Melbourne Metro, with mixed-use ($6.4B or 45.4%) being a focus. Moonee Valley Racecourse redevelopment ($1.2B) is a major mixed-use project, adding 2,000 dwellings, a grandstand, racecourse park, and community facilities. Winged Foot Dr Dwellings ($200.0M, 84 dwellings) and Cremorne Malt Precinct ($100.0M, 209 units) are two significant residential projects that will cater to increasing housing demand due to population growth within Melbourne Metro.
Methodology
This affordable and liveable property guide for Melbourne analyses all suburbs in the Greater Melbourne, within a 20km radius of the Melbourne CBD. The following criteria were considered:
- Property trends criteria – all suburbs considered have a minimum of 20 transactions for statistical reliability purposes, with positive price growth between 2017 to 2018/191.
- Investment criteria – as of December 2018, all suburbs considered will have an on-par or higher rental yield than Melbourne Metro, and an on-par or lower vacancy rate.
- Affordability criteria – all identified suburbs required a median price below a set threshold. This was determined by adding percentage premiums to the VIC average home loan, which was $409,1514 as of Q4 2018. Premiums of 147% for houses and 42% for units were added, which were below those required to reach Melbourne Metro’s median prices (186% for houses and 43% for units). This places the suburbs below Melbourne's median prices, meaning that the affordable and liveable suburbs identified within this report are more affordable for buyers.
- Development criteria – all suburbs reviewed have a high total estimated value of future project developments for the 1st half of 2019, as well as a higher proportion of commercial and infrastructure projects. This ensures suburbs chosen show signs of sustainable economic growth, which in turn has a positive effect on the property market.
- Liveability criteria – this included ensuring all suburbs assessed have low crime rates, availability of amenities within a 5km radius (i.e. schools, green spaces, public transport, shopping centres and health care facilities), and an unemployment rate on-par or lower in comparison to the state average (as determined by the Department of Jobs and Small Business, December Quarter 2018 release).
PRD Affordable and Liveable Property Guide 1st Half 2019 - Melbourne


