Q1 2019 Key Market Indicators – South Australia
South Australia (SA) showed steady economic fundamentals in late 2018, which are set to continue in 2019. The unemployment rate in SA was 5.9% in December 2018, which showed no change when compared to the 12 months prior. This is good news, as there has been no loss in the number of people employed and contributing towards the economy.
South Australia remains steady
South Australia (SA) showed steady economic fundamentals in late 2018, which are set to continue in 2019. The unemployment rate in SA was 5.9% in December 2018, which showed no change when compared to the 12 months prior. This is good news, as there has been no loss in the number of people employed and contributing towards the economy.
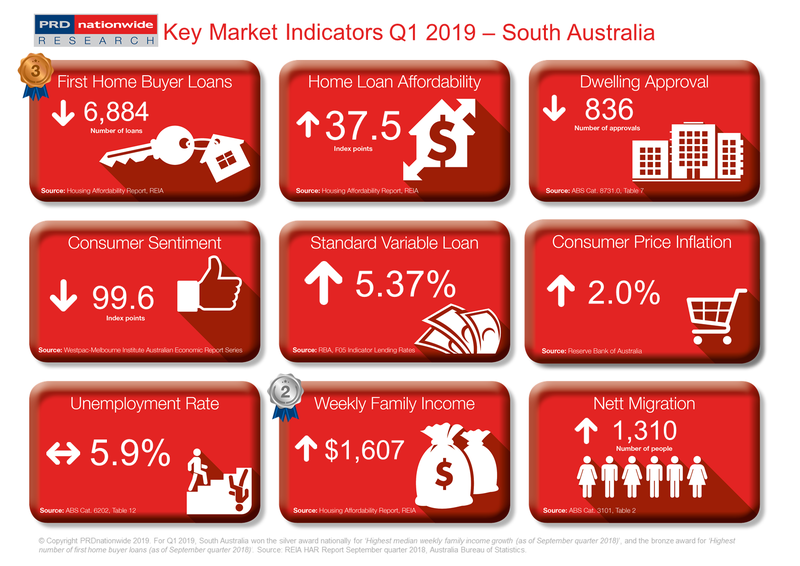
Those employed are faring better in the September quarter of 2018, with a median weekly family income of $1,607, which is a 2.6% increase over the past 12 months. A 2.6% growth in weekly family median income is in line with growth in New South Wales, Queensland, and the Australian average. This suggests high wage growth will be a strong economic fundamental for SA in 2019, as it means those who are employed will be able to afford more and increase their standard of living.
Coincidentally, the home loan affordability index in SA has improved over the past 12 months (to the September quarter of 2018) by 1.4%. This brings the index reading up to 37.5 points, which is higher than New South Wales, Queensland, Victoria, and the Australian average. This is good news for local SA residents who are looking to enter the market, as well as interstate investors.
More Australians are choosing to call SA home, with nett migration recording 1,310 people in June 2018. This is a large increase in comparison to the 548 people whom migrated in June 2017. Interestingly, the number of dwelling approvals in SA decreased by -14.6% over the past 12 months (to December 2018), which suggests an imbalance between supply and demand in the future. This presents a golden opportunity for developers to consider SA for their next project.
The PRD Q1 2019 Key Economic Indicators provide consumers with a quick snapshot of the current state of the market in Australia, from an economic and property perspective. The Indicators cover both national and state level data, comprising of:
- Number of loans to first home buyers
- Home loan affordability index
- Number of dwelling approvals
- Consumer sentiment index
- Standard variable loan
- Consumer price inflation index
- Unemployment rate
- Weekly family income
- Nett migration
View the Q1 2019 Key Market Indicators


