Q3 2018 Key Market Indicators – Northern Territory
The Northern Territory (NT) takes out the gold award nationally for most improved home loan affordability index growth two quarters in a row, recording a 6.3% growth over the past 12 months to March 2018.
Northern Territory continues to climb the affordability ladder, providing untapped opportunities for those willing to step outside of the box.
The Northern
Territory (NT) takes out the gold award nationally for most improved home loan affordability index growth two quarters in
a row, recording a 6.3% growth over the past 12 months to March 2018. With
a home loan affordability index reading
of 47.4 points the NT takes out the silver award nationally in this category, a
reading that is significantly higher than the Australian average of 31.9 index
points.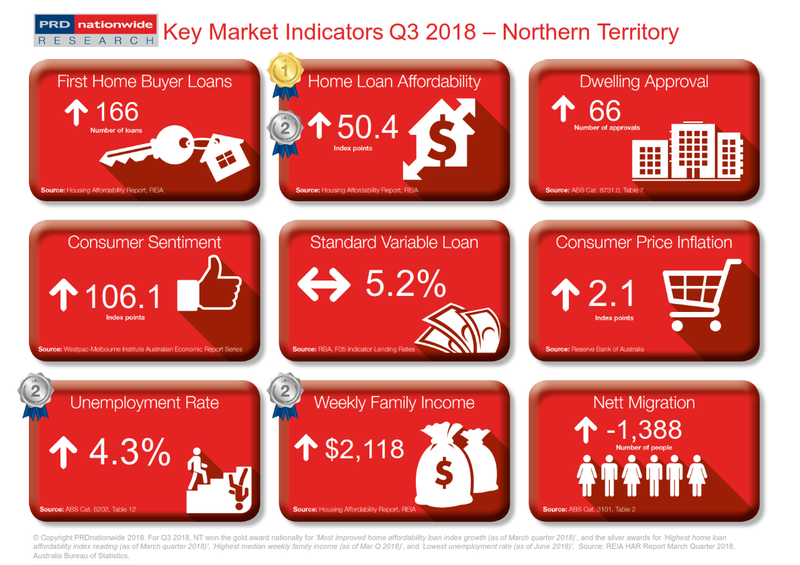
The NT has proven to have a friendlier property market to first home buyers, with the number of first home buyer loans increasing by 29.7% over the past 12 months to March quarter 2018. This is slightly above the Australian average (28.0%) and significantly above Queensland (5.0%), South Australia (7.5%), Western Australia (0.5%), and Tasmania (6.9%).
Although the NT may not be the most obvious choice for interstate migration, there are untapped opportunities within the state. Unemployment rate in the NT is the second lowest in the country, at 4.3%, much lower than the Australian average of 5.4% in June 2018. Furthermore, the NT has again taken out the silver award nationally for the highest median weekly family income, recording $2,118 in March quarter 2018. This is a slight increase from the recorded $2,113 in December quarter 2017. Thus there is higher chance of employment and/or a healthier household income in the NT.
The NT economy is at an interesting cross-road, coming off the mining boom and transitioning to a service and tourism driven economy. The above three key market indicators: unemployment rate, median weekly family income, and home loan affordability; suggests there are untapped employment and home ownership opportunities for those willing to step outside the box and take a chance.
The PRD Q3 2018 Key Market Indicators provide a quick snapshot of the current state of the market in Australia from both an economic and property perspective. The Indicators cover both national and state level data, comprising of:
- Number
of loans to first home buyers
- Home
loan affordability index
- Number
of dwelling approvals
- Consumer
sentiment index
- Standard
variable loan
- Consumer
price inflation index
- Unemployment
rate
- Weekly
family income
- Nett
migration
View the Q3 2018 Key Market Indicators


