Q3 2018 Key Market Indicators – South Australia
SA took the silver award nationally for highest median growth in median weekly family income, at 2.6% over the past 12 months to March quarter 2018. This should increase household median income and assist those wanting to enter the property market. Already the number of first home buyers have increased by 7.5% over the past 12 months to March 2018, to 1297 loans.
South Australia is a top performer: most improved unemployment rate, highest growth in median weekly family income, and higher than average home loan affordability index.
SA took
the silver award nationally for highest
median growth in median weekly family income, at 2.6% over the past 12
months to March quarter 2018. This should increase household median income and
assist those wanting to enter the property market. Already the number of first home buyers have
increased by 7.5% over the past 12 months to March 2018, to 1297 loans.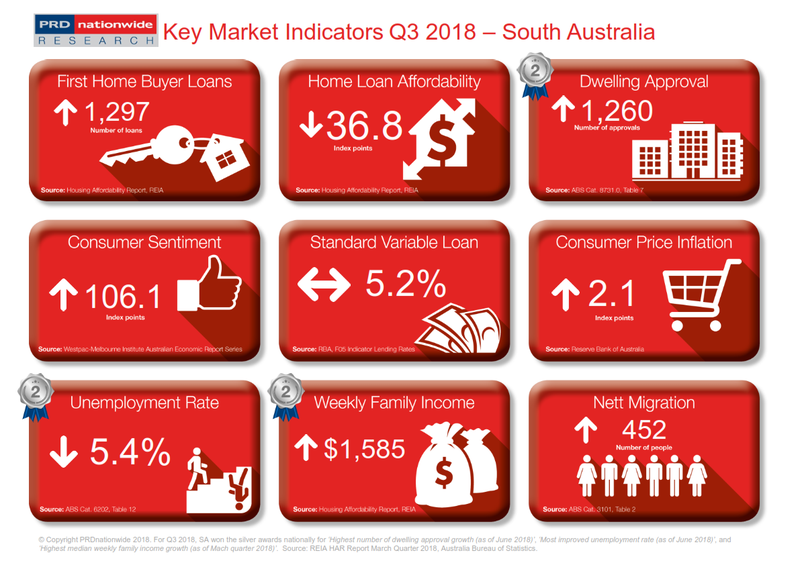
There has been a decline in SA’s home loan affordability index reading, by -3.7% over the past 12 months to March 2018. However, this still puts SA above the average Australian index reading (31.9 points), at 36.8 index points. Furthermore, SA took the silver award nationally in most improved unemployment rate, declining by an impressive -18.2% over the past 12 months June 2018, bringing it to an even level with the Australian average of 5.4%. This suggests more people are employed, and thus a greater potential for renters to transition to becoming home owners.
South Australia (SA) is an increasingly attractive place for those looking for a career and/or lifestyle change, whereby nett migration more than tripled over the past 12 months to December 2017. This means 452 people made the move. Although this figure seems low compared to other states such as New South Wales (8,478), Victoria (19,019), and Queensland (9,174); it represented significant growth for SA, given its low nett migration figures in the past.
However, there is an imbalance in the number of dwelling approvals and interstate migration. Dwelling approvals only grew by 22.7% over the past 12 months to June 2018 whereas nett migration more than tripled over the past 12 months to December 2017. This suggests the need for state-wide strategy that focuses on increasing supply, before affordability becomes a concerning issue.
The PRD Q3 2018 Key Market Indicators provide a quick snapshot of the current state of the market in Australia from both an economic and property perspective. The Indicators cover both national and state level data, comprising of:
- Number
of loans to first home buyers
- Home
loan affordability index
- Number
of dwelling approvals
- Consumer
sentiment index
- Standard
variable loan
- Consumer
price inflation index
- Unemployment
rate
- Weekly
family income
- Nett
migration
View the Q3 2018 Key Market Indicators


