Q4 2018 Key Market Indicators – Western Australia
As of June 2018, WA’s home loan affordability index reading was 41.8 index points, well above the Australian average of 31.1 index points. That said, this is a slight decline when compared to the March quarter of 2017, where WA recorded a home loan affordability index reading of 42.8 points. This is potentially explained by the mild increase in WA’s property metro prices, due to higher quality stock entering the market over the past 6 months.
Western Australia presents unique affordable options.
Western Australia (WA) has again earned the bronze award nationally
for both highest home loan affordability
index reading and highest median
weekly family income categories in the PRD Q4 2018 Key Market Indicator Awards. WA also won these awards in Q3
2018.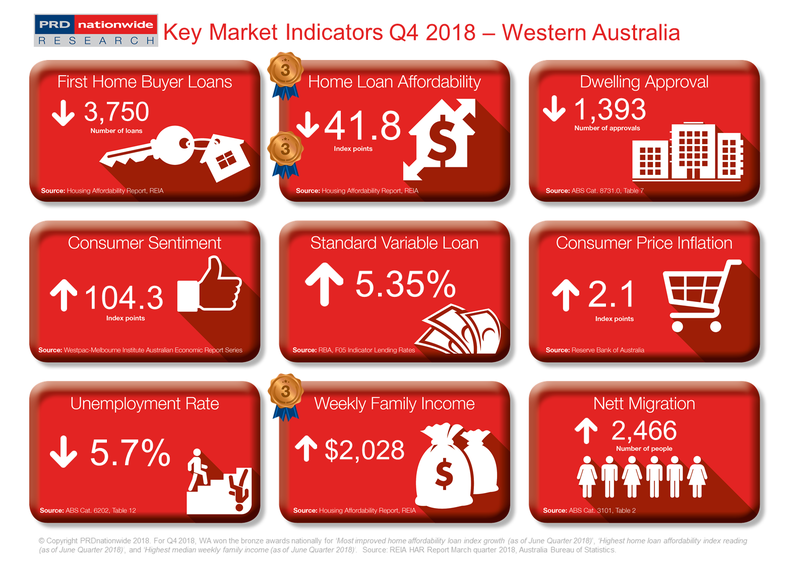 As of June 2018, WA’s home
loan affordability index reading was 41.8 index points, well above the
Australian average of 31.1 index points. That said, this is a slight decline
when compared to the March quarter of 2017, where WA recorded a home loan
affordability index reading of 42.8 points. This is potentially explained by
the mild increase in WA’s property metro prices, due to higher quality stock
entering the market over the past 6 months.
As of June 2018, WA’s home
loan affordability index reading was 41.8 index points, well above the
Australian average of 31.1 index points. That said, this is a slight decline
when compared to the March quarter of 2017, where WA recorded a home loan
affordability index reading of 42.8 points. This is potentially explained by
the mild increase in WA’s property metro prices, due to higher quality stock
entering the market over the past 6 months.
Nett migration into WA has increased by a significant 41.5% over the past 12 months to March 2018, which is the second highest growth in nett migration figures across Australia. This is great news for the property market as it will allow for current stock to be absorbed. Furthermore, dwelling approvals have declined by -17.1% over the past 12 months to September 2018, which suggests that there may even be a potential undersupply in the market in the long run.
WA continues to be a top performer for income, earning a bronze award nationally in the highest median weekly family income category, with the median weekly family income increasing from $2,021 in the March quarter of 2018, to $2,028 in the June quarter of 2018. This represents a 1.7% increase, which is a stable increase compared to the December quarter of 2017 to the March quarter of 2018’s growth. Furthermore, unemployment in WA declined by -5.0% over the past 12 months to October 2018, thus there are more people with incomes. Combined, these two factors create solid fundamentals for a resilient economy in 2019.
The
PRD Q4 2018 Key Market Indicators provide a quick snapshot of the
current state of the market in Australia from both an economic and property
perspective. The Indicators cover both national and state level data,
comprising of:
- Number
of loans to first home buyers
- Home
loan affordability index
- Number
of dwelling approvals
- Consumer
sentiment index
- Standard
variable loan
- Consumer
price inflation index
- Unemployment
rate
- Weekly
family income
- Nett
migration
View the Q4 2018 Key Market Indicators


