Sydney - Affordable & Liveable Property Guide 1st Half 2018
Between 2016 to 2017/18, Sydney Metro median house prices experienced a gentle growth of 0.8%, whilst units softened by -2.4%. This is reflective of a pivot in the metro unit market and a response to the increased unit supply, confirming a return towards a more sustainable market. Now is the time for buyers to enter the market and capitalise on opportunities of affordability. Prospective houses buyers looking for affordable options should look toward Sydney’s south-western suburbs. A particularly attractive market for investors can be found in Parramatta, which experienced a 20.8% in annual growth and is expecting a further $297.2M of investment in the 1st half of 2018.

Affordable Suburbs - Sydney
Between 2016 to 2017/18, Sydney Metro median house prices experienced a gentle growth of 0.8%, whilst units softened by -2.4%. This is reflective of a pivot in the metro unit market and a response to the increased unit supply, confirming a return towards a more sustainable market. Now is the time for buyers to enter the market and capitalise on opportunities of affordability. Prospective houses buyers looking for affordable options should look toward Sydney’s south-western suburbs. A particularly attractive market for investors can be found in Parramatta, which experienced a 20.8% in annual growth and is expecting a further $297.2M of investment in the 1st half of 2018.
Table 1. Sydney’s top performing suburbs in the 1st half of
2018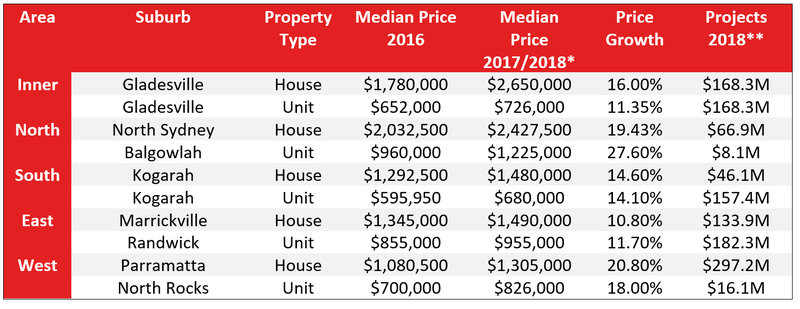
The number of first home buyers in New South Wales increased by 74.9% over the past 12 months to December 2017 quarter^, which further signals a return towards a sustainable market. Table 2 provides the percentage of suburbs that are available for house buyers.
Table 2. Accessible suburbs by price range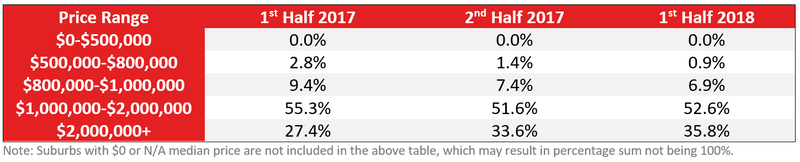
Liveable Suburbs - Sydney
2018 sees liveability added as a new criterion included in our methodology. This ensures that not only does our report highlight affordable suburbs but also those that have high liveability factors. This provides us with insight to the ‘cost of liveability’ and how much home buyers need to be prepared to pay. It also serves as a warning to local and state governments on the rising costs of liveability. It also provides focus areas for further development to create a balanced opportunity for residents, regardless of their income bracket.
Highly affordable suburbs (those with a maximum property sale price of the average state loan, plus a 90% deposit) exist. There are 8 suburbs that fall within this category, including: Fairfield East, Villawood, Guildford, Granville. However, these suburbs fail to meet the liveability criteria set. 135% for houses and 80% for units needed to be added to the average state loan to meet liveability criteria. Thus, the average cost of liveability (based on average percentage difference of premiums added to average state loan) in Sydney is 18%. This is the highest among all major capital cities, however surprisingly only slightly compared to Hobart (16%).
Affordable & Liveable Suburbs - Sydney
Considering a combination of key property criteria such as: property trends, investment potential, affordability, project development and liveability factors; the tables below show the suburbs that should be on every property watchers list.
Table 3. Affordable
and liveable suburbs - Houses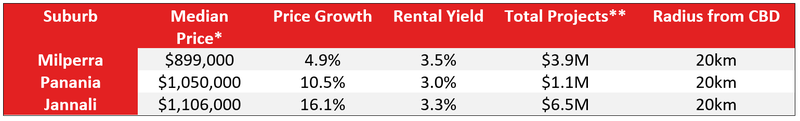
Table 4. Affordable
and liveable suburbs - Units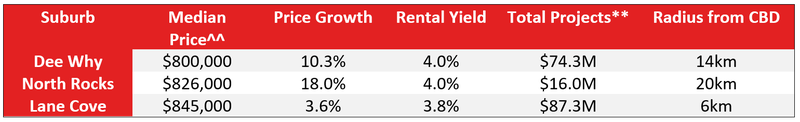
Sydney’s rental market has presented strength in annual price growth, increasing by 6.3% to $510 for 3 bedroom houses and by 3.8% to $550 for 2 bedroom units. That said, more recently (Q3-Q4 2017), rent for units experienced a partial softening of -1.8%, whilst houses have shown resilience with no change. This is reflective of the increase in unit stock and rising vacancy rate trend, recorded at 2.6% in December 2017. Despite this, investors are urged to hold onto their assets, lock in prices and secure longer tenancies. For prospective investors, they are urged to buy into affordable and liveable suburbs such as the ones mentioned in tables 3 and 4.
Over the 1st half 2018, Sydney Metro will see a number of new developments commence. The majority of development will be focused on infrastructure projects, valued at a substantial $14.0B. This will include the Central to Eveleigh Urban Renewal & Transport Program, which is a 20-30 year state funded program aiming to deliver 9,000 dwellings and more than 300,000sqm of commercial space. Further mixed-use, commercial and residential development will play a major role in achieving greater liveability and future economic growth.
Methodology
This guide analyses all suburbs within the greater Sydney area. The suburbs chosen as the most affordable and liveable hotspots are within a 20km radius of the CBD. In selecting hotspots, the below factors and methodology were considered:
- Property trends - suburbs will have a minimum of 20
transactions for statistical reliability purposes, with positive price growth
over the past 15 months (2016 to Q1 2018*).
- Investment -
suburbs will have on-par or higher rental yield than Brisbane Metro, as well as
on-par or lower vacancy rates (as of December 2017).
- Affordability and liveability
- suburbs will have a median price below the maximum affordable property
sale price, based on the average state loan. In this report 135%
for houses and 80% for units were added to the average New
South Wales home loan, which was $476,449 as at December 2017^^. Key liveability
factors included ensuring the suburbs have a low crime rate, availability of
amenities were within a 5km radius (i.e. schools, parks, shopping centres, and
health care facilities), and an unemployment rate that is on par or lower in
comparison to the state average (as determined by the ABS Census 2016).
- Project development - suburbs will have a high total estimated value
of future project development for the 1st half of 2018**. This ensures
sustainable economic growth, having a positive effect on to the property
market.
PRD Affordable & Liveable Property Guide 1st Half 2018 - Sydney.pdf


