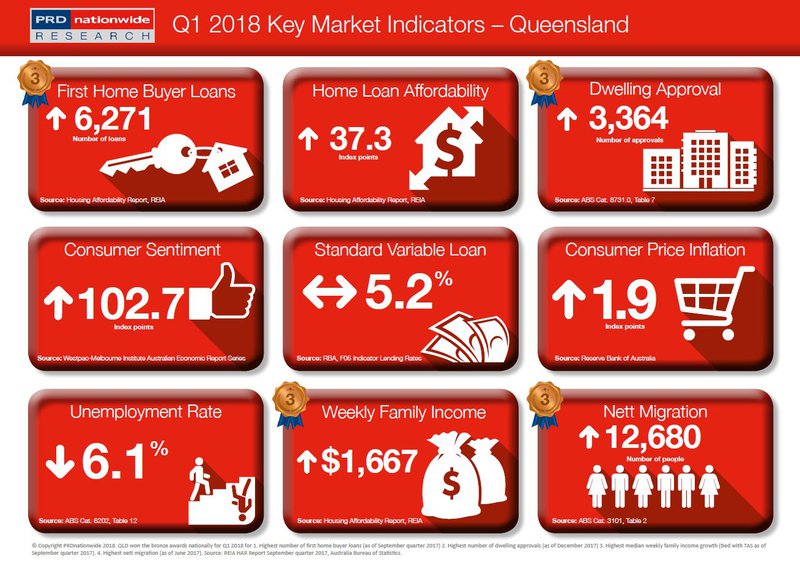
Q1 2018 Key Market Indicators – Queensland

And the bronze for “highest number of first home buyer loans” goes to….Queensland!
The number of first home buyer loans in Queensland as of September quarter 2017 is 6271 loans, making it the 3rd highest number of first home buyer loans across the country, after Victoria (8786 loans) and NSW (6775 loans). This is an interesting and unexpected result for Queensland, considering that the state has been known for the more affordable property prices in comparison to Victoria and NSW – suggesting that improvements related to first home buyers policies are needed.
That said there is good news, perhaps more so for non-first home buyers, as Queensland’s home affordability loan index increased by 3.6% over the past 12 months to September quarter 2017, with a reading of 37.3 index points. This certainly is above NSW and VIC’s home affordability loan index growth (at 3.0% and 0.6% respectively) and well above the Australian home loan affordability index (at 33.0 index points), however it is a pale comparison to the home loan affordability loan index of South Australia (4.2%), Western Australia (6.4%), Northern Territory (5.7%), and ACT (8.6%).
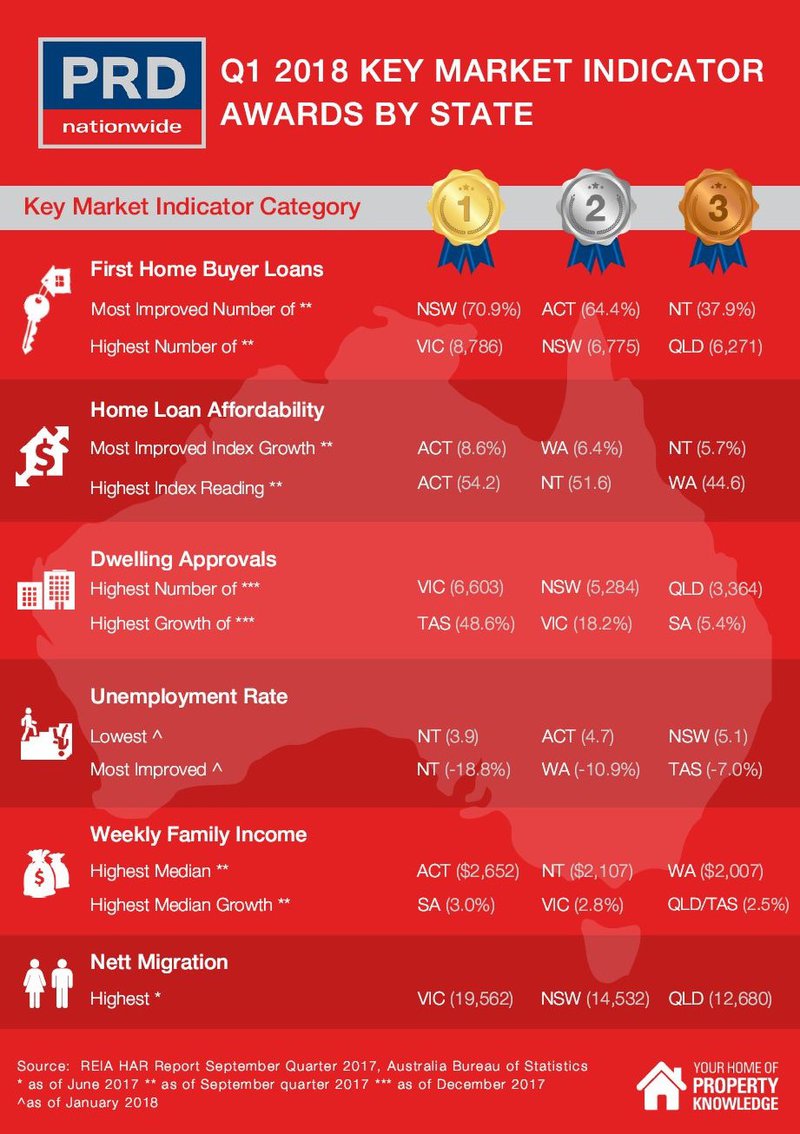
Queensland ties with Tasmania for the bronze in the “highest median weekly family income growth” award category, at 2.5%. This is encouraging for Queenslanders, as their median weekly family income climbs up to $1667 per week – getting closer to the Australian average of $1711 per week. What’s more the Queensland unemployment rate decreased by -1.6% as of January 2018, bringing it down to 6.1%.
Queensland takes out the bronze for the “highest number of nett migration” over the past 12 months to June 2017, reporting 12680 people. This signifies a 72.7% increase and is the highest percentage growth when compared to VIC (11.9%) and NSW (39.2%), suggesting that the demand for property is about to surge dramatically. Queensland also takes out the bronze for “highest number of dwelling approvals” (as of December 2017) at 3364 approvals, signifying a 5.4% increase. That said, considering the 72.7% increase in nett migration, now is the perfect time for developers make their move.
The PRD Q1 2018 Key Economic Indicators provide consumers with a quick snapshot of the current state of affairs from an economic and property perspective. The PRD Key Economic Indicators cover both national and state level data, comprising of:
a) Number of loans to first home buyers
b) Home loan affordability index
c) Number of dwelling approvals
d) Consumer sentiment index
e) Standard variable loan
f) Consumer price inflation index
g) Unemployment rate
h) Weekly family income
i) Nett migration
For more information on the PRD Q1 2018 Key Economic Indicators please contact Dr Diaswati Mardiasmo, National Research Manager, at astimardiasmo@prd.com.au