Ashmore & Molendinar Property Factsheet 1st Half 2018
Download Factsheet here:
Ashmore & Molendinar Property Factsheet 1st Half 2018
MARKET CONDITIONS
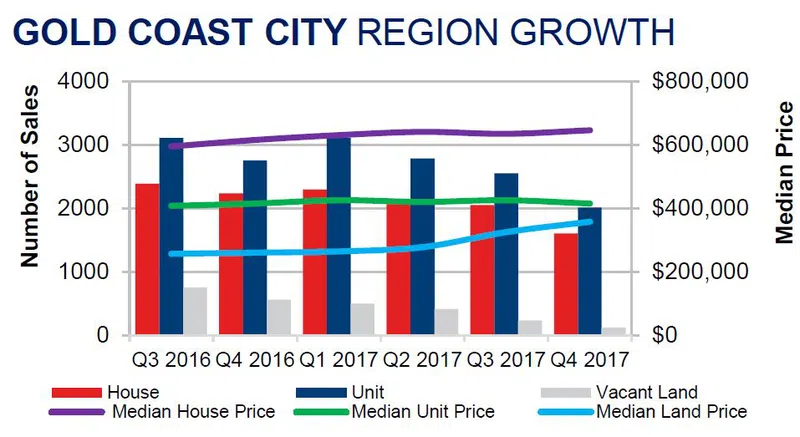
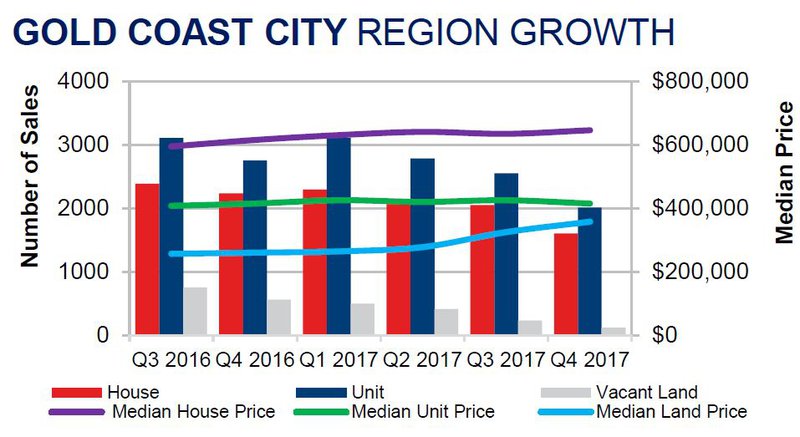
The Ashmore and Molendinar aggregate property market recorded a median house price of $632,500 and $345,000 for units in Q4 2017, representing an annual price growth of 6.3% and 0.4% respectively. Over the same period of time (Q4 2016-Q4 2017) house prices in the Gold Coast City Region grew by 4.9% to $645,000 while unit prices remained stable at $415,000. This indicates Ashmore and Molendinar as more attractive options for both first home buyers and investors. When compared to the wider Gold Coast LGA they provide a combination of affordability and positive capital growth.
Over the past 12 months to Q4 2017, average vendor discounting for units has tightened to -1.4%. This suggests sellers are achieving closer to their first asking price and there is only little room for price negotiation. Now is the time for sellers to capitalise on increasing competition within the unit market. On the other hand, the house market is slowly turning into a buyer’s market, with average vendor discounting widening to -3.8% and average days to sell increasing to 77 days. This confirms that now is the time of first home buyers to enter the house market and secure their dream property.
Median weekly rent in the Ashmore and Molendinar areas in Q4 2017 was $540 for houses and $385 for units, representing an annual price growth of -1.8% and 1.3% respectively. Continuously low vacancy rates of 1.2% (on par with Gold Coast Main’s), demonstrate strong rental demand in the area. Investors are benefiting from an average of 4.7% (house) and 6.1% (units) rental yields, higher than Gold Coast’s 4.3% and 5.4% respectively.
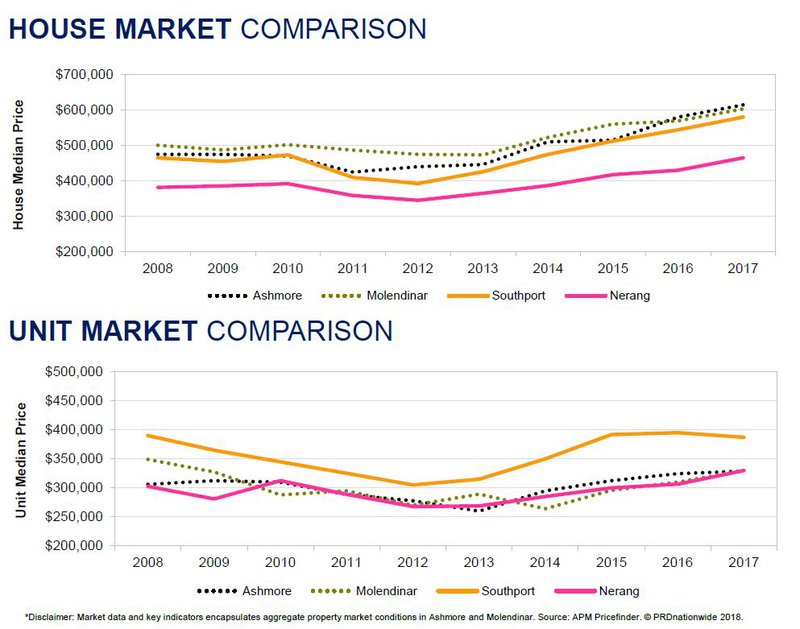
MARKET COMPARISON GRAPH
The market comparison graph provides comparative trend for median price of house and units over the past 10 years. Suburbs profiled are chosen based on proximity to the main suburbs analysed in the factsheet, which are Ashmore and Molendinar. These suburbs are highlighted through dotted line graphs.