


WOONGOOLBA, QLD
Under Offer
UNDER OFFER
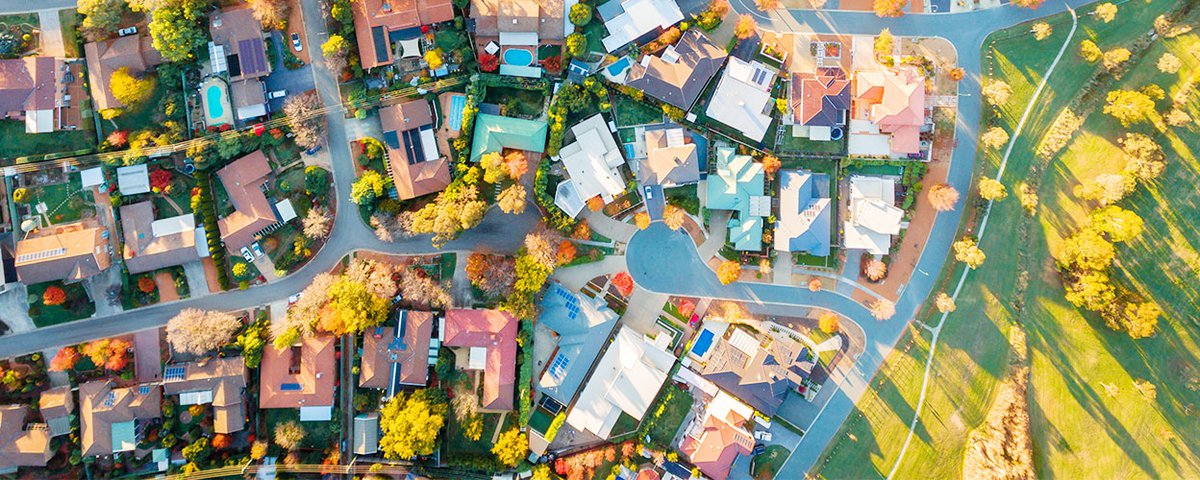
Helensvale offers a lifestyle that blends convenience with coastal charm, making it one of the Northern Gold Coast’s most desirable suburbs. Families love the excellent schools, parks, and community feel, while commuters appreciate the seamless access to Brisbane and Gold Coast beaches via the M1 and train station. Downsizers enjoy modern, low-maintenance homes that free up weekends, and investors see opportunity in a market that continues to deliver strong rental returns and consistent growth.
This page provides a clear, data-driven snapshot of Helensvale and surrounding suburbs such as Coomera, Upper Coomera, Pimpama, Ormeau, Pacific Pines, Maudsland, Jacobs Well, Alberton, and Woongoolba. Here you’ll find:
Whether you’re buying your first home, upgrading for more space, downsizing for simplicity, or expanding your investment portfolio, these insights will help you make informed decisions. Helensvale’s property market is diverse and dynamic, perfect for families seeking room to grow, commuters wanting city access with coastal living, and investors looking for high-demand areas like Coomera and Pimpama.
For personalised advice or help interpreting the numbers, reach out to PRD Helensvale. Our team combines local expertise with national research to guide you through every step of your property journey. We’re here to make your next move smarter, easier, and more rewarding.
| TYPE | MEDIAN PRICE | ANNUAL GROWTH | MEDIAN RENTAL PRICE | RENTAL YIELD |
|---|---|---|---|---|
| House | 1265000 | 12.4% | 1100 | 4.5% |
| Unit | 933000 | 6.0% | 750 | 4.2% |
Disclaimer: Median house and unit price is based on the number of sales within the last 12 months (Financial Year 2026). It is based on a rolling 12 month period and may differ from calendar year statistics. Annual growth is based on median price comparison over the last two rolling 12-month periods. Data source: AMP Pricefinder, Suburb Flyover Reports.
| TYPE | MEDIAN PRICE | ANNUAL GROWTH | MEDIAN RENTAL PRICE | RENTAL YIELD |
|---|---|---|---|---|
| House | 950000 | 14.5% | 780 | 4.3% |
| Unit | 799900 | 13.1% | 680 | 4.4% |
Disclaimer: Median house and unit price is based on the number of sales within the last 12 months (Financial Year 2026). It is based on a rolling 12 month period and may differ from calendar year statistics. Annual growth is based on median price comparison over the last two rolling 12-month periods. Data source: AMP Pricefinder, Suburb Flyover Reports.
| TYPE | MEDIAN PRICE | ANNUAL GROWTH | MEDIAN RENTAL PRICE | RENTAL YIELD |
|---|---|---|---|---|
| House | 1002500 | 13.0% | 840 | 4.4% |
| Unit | 822500 | 15.9% | 700 | 4.4% |
Disclaimer: Median house and unit price is based on the number of sales within the last 12 months (Financial Year 2026). It is based on a rolling 12 month period and may differ from calendar year statistics. Annual growth is based on median price comparison over the last two rolling 12-month periods. Data source: AMP Pricefinder, Suburb Flyover Reports.
| TYPE | MEDIAN PRICE | ANNUAL GROWTH | MEDIAN RENTAL PRICE | RENTAL YIELD |
|---|---|---|---|---|
| House | 950000 | 17.4% | 740 | 4.1% |
| Unit | 755900 | 8.1% | 655 | 4.5% |
Disclaimer: Median house and unit price is based on the number of sales within the last 12 months (Financial Year 2026). It is based on a rolling 12 month period and may differ from calendar year statistics. Annual growth is based on median price comparison over the last two rolling 12-month periods. Data source: AMP Pricefinder, Suburb Flyover Reports.
| TYPE | MEDIAN PRICE | ANNUAL GROWTH | MEDIAN RENTAL PRICE | RENTAL YIELD |
|---|---|---|---|---|
| House | 975000 | 6.0% | 1000 | 5.3% |
| Unit | 1585000 | 36.6% | 800 | 2.6% |
Disclaimer: Median house and unit price is based on the number of sales within the last 12 months (Financial Year 2026). It is based on a rolling 12 month period and may differ from calendar year statistics. Annual growth is based on median price comparison over the last two rolling 12-month periods. Data source: AMP Pricefinder, Suburb Flyover Reports.
Source: Suburb Flyover Report Series, APM Pricefinder. PRD does not give any warranty in relation to the accuracy of the information contained in this report. If you intend to rely upon the information contained herein, you must take note that the Information, figures and projections have been provided by various sources and have not been verified by us. We have no belief one way or the other in relation to the accuracy of such information, figures and projections. PRD will not be liable for any loss or damage resulting from any statement, figure, calculation or any other information that you rely upon that is contained in the material. Prepared by PRD Research © All medians and volumes are calculated by PRD Research. Use with written permission only. All other responsibilities disclaimed.
Connect with us


