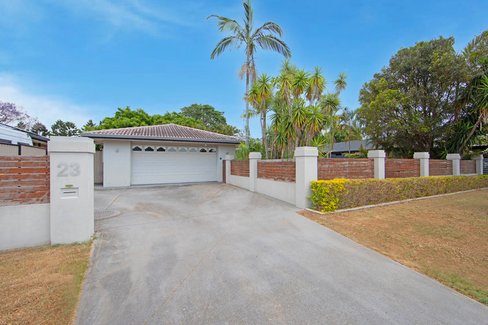
Currumbin Waters
At a glance:
Currumbin Waters provides a balance between suburban living and natural beauty. With its creeks, parks, and proximity to Currumbin Beach, it’s a popular choice for families and retirees. The area’s relaxed atmosphere and convenience make it a coastal gem.
Property Trends currumbin waters
| TYPE | MEDIAN PRICE | ANNUAL GROWTH | MEDIAN RENTAL PRICE | RENTAL YIELD |
|---|---|---|---|---|
| House | 1415000 | 3.1% | 1150 | 4.2% |
| Unit | 850000 | 9.7% | 800 | 4.9% |
Disclaimer: Median house and unit price is based on the number of sales within the last 12 months (Financial Year 2025). It is based on a rolling 12 month period and may differ from calendar year statistics. Annual growth is based on median price comparison over the last two rolling 12-month periods. Data source: AMP Pricefinder, Suburb Flyover Reports.
Growth Chart currumbin waters (Houses)
Property Trends currumbin
| TYPE | MEDIAN PRICE | ANNUAL GROWTH | MEDIAN RENTAL PRICE | RENTAL YIELD |
|---|---|---|---|---|
| House | 2112500 | 25.4% | 1150 | 2.8% |
| Unit | 1080000 | 8.0% | 850 | 4.1% |
Disclaimer: Median house and unit price is based on the number of sales within the last 12 months (Financial Year 2025). It is based on a rolling 12 month period and may differ from calendar year statistics. Annual growth is based on median price comparison over the last two rolling 12-month periods. Data source: AMP Pricefinder, Suburb Flyover Reports.
Growth Chart currumbin (Houses)
Property Trends currumbin valley
| TYPE | MEDIAN PRICE | ANNUAL GROWTH | MEDIAN RENTAL PRICE | RENTAL YIELD |
|---|---|---|---|---|
| House | 2142500 | 3.8% | 1100 | 2.7% |
| Unit | 1678850 | 19.9% | 700 | 2.2% |
Disclaimer: Median house and unit price is based on the number of sales within the last 12 months (Financial Year 2025). It is based on a rolling 12 month period and may differ from calendar year statistics. Annual growth is based on median price comparison over the last two rolling 12-month periods. Data source: AMP Pricefinder, Suburb Flyover Reports.
Growth Chart currumbin valley (Houses)
Property Trends elanora
| TYPE | MEDIAN PRICE | ANNUAL GROWTH | MEDIAN RENTAL PRICE | RENTAL YIELD |
|---|---|---|---|---|
| House | 1350000 | 5.7% | 1050 | 4.0% |
| Unit | 835500 | 10.2% | 785 | 4.9% |
Disclaimer: Median house and unit price is based on the number of sales within the last 12 months (Financial Year 2025). It is based on a rolling 12 month period and may differ from calendar year statistics. Annual growth is based on median price comparison over the last two rolling 12-month periods. Data source: AMP Pricefinder, Suburb Flyover Reports.
Growth Chart elanora (Houses)
Recent Properties
Source: Suburb Flyover Report Series, APM Pricefinder. PRD does not give any warranty in relation to the accuracy of the information contained in this report. If you intend to rely upon the information contained herein, you must take note that the Information, figures and projections have been provided by various sources and have not been verified by us. We have no belief one way or the other in relation to the accuracy of such information, figures and projections. PRD will not be liable for any loss or damage resulting from any statement, figure, calculation or any other information that you rely upon that is contained in the material. Prepared by PRD Research © All medians and volumes are calculated by PRD Research. Use with written permission only. All other responsibilities disclaimed.