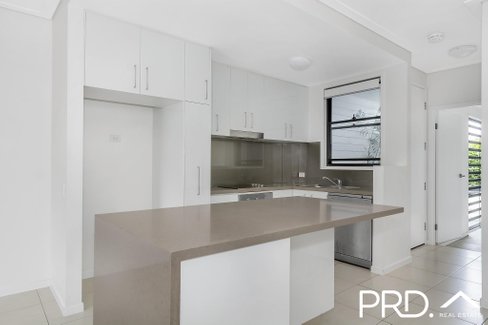
Bilinga
At a glance:
Bilinga is a peaceful beachfront suburb known for its golden sands, relaxed atmosphere, and direct access to some of the Coast’s most beautiful stretches of coastline. Real estate in Bilinga includes beachfront apartments, low-rise coastal residences, and a growing selection of modern developments appealing to downsizers and lifestyle-focused buyers. The suburb offers a quieter alternative to neighbouring hotspots, while still being only minutes from Coolangatta, Tugun Village, and the airport. Its uncrowded beaches, walking paths, and strong community feel make it ideal for those seeking a laid-back coastal lifestyle. With limited beachfront land and rising demand, Bilinga remains a highly desirable and tightly held property market.
Property Trends bilinga
| TYPE | MEDIAN PRICE | ANNUAL GROWTH | MEDIAN RENTAL PRICE | RENTAL YIELD |
|---|---|---|---|---|
| House | 1473500 | -69.7% | 1100 | 3.9% |
| Unit | 1550000 | -0.5% | 760 | 2.5% |
Disclaimer: Median house and unit price is based on the number of sales within the last 12 months (Financial Year 2025). It is based on a rolling 12 month period and may differ from calendar year statistics. Annual growth is based on median price comparison over the last two rolling 12-month periods. Data source: AMP Pricefinder, Suburb Flyover Reports.
Growth Chart bilinga (Houses)
Property Trends coolangatta
| TYPE | MEDIAN PRICE | ANNUAL GROWTH | MEDIAN RENTAL PRICE | RENTAL YIELD |
|---|---|---|---|---|
| House | 1875000 | -2.5% | 1200 | 3.3% |
| Unit | 1200000 | - | 780 | 3.4% |
Disclaimer: Median house and unit price is based on the number of sales within the last 12 months (Financial Year 2025). It is based on a rolling 12 month period and may differ from calendar year statistics. Annual growth is based on median price comparison over the last two rolling 12-month periods. Data source: AMP Pricefinder, Suburb Flyover Reports.
Growth Chart coolangatta (Houses)
Property Trends tugun
| TYPE | MEDIAN PRICE | ANNUAL GROWTH | MEDIAN RENTAL PRICE | RENTAL YIELD |
|---|---|---|---|---|
| House | 1450000 | 5.1% | 1050 | 3.8% |
| Unit | 980000 | 5.0% | 800 | 4.2% |
Disclaimer: Median house and unit price is based on the number of sales within the last 12 months (Financial Year 2025). It is based on a rolling 12 month period and may differ from calendar year statistics. Annual growth is based on median price comparison over the last two rolling 12-month periods. Data source: AMP Pricefinder, Suburb Flyover Reports.
Growth Chart tugun (Houses)
Recent Properties
Source: Suburb Flyover Report Series, APM Pricefinder. PRD does not give any warranty in relation to the accuracy of the information contained in this report. If you intend to rely upon the information contained herein, you must take note that the Information, figures and projections have been provided by various sources and have not been verified by us. We have no belief one way or the other in relation to the accuracy of such information, figures and projections. PRD will not be liable for any loss or damage resulting from any statement, figure, calculation or any other information that you rely upon that is contained in the material. Prepared by PRD Research © All medians and volumes are calculated by PRD Research. Use with written permission only. All other responsibilities disclaimed.