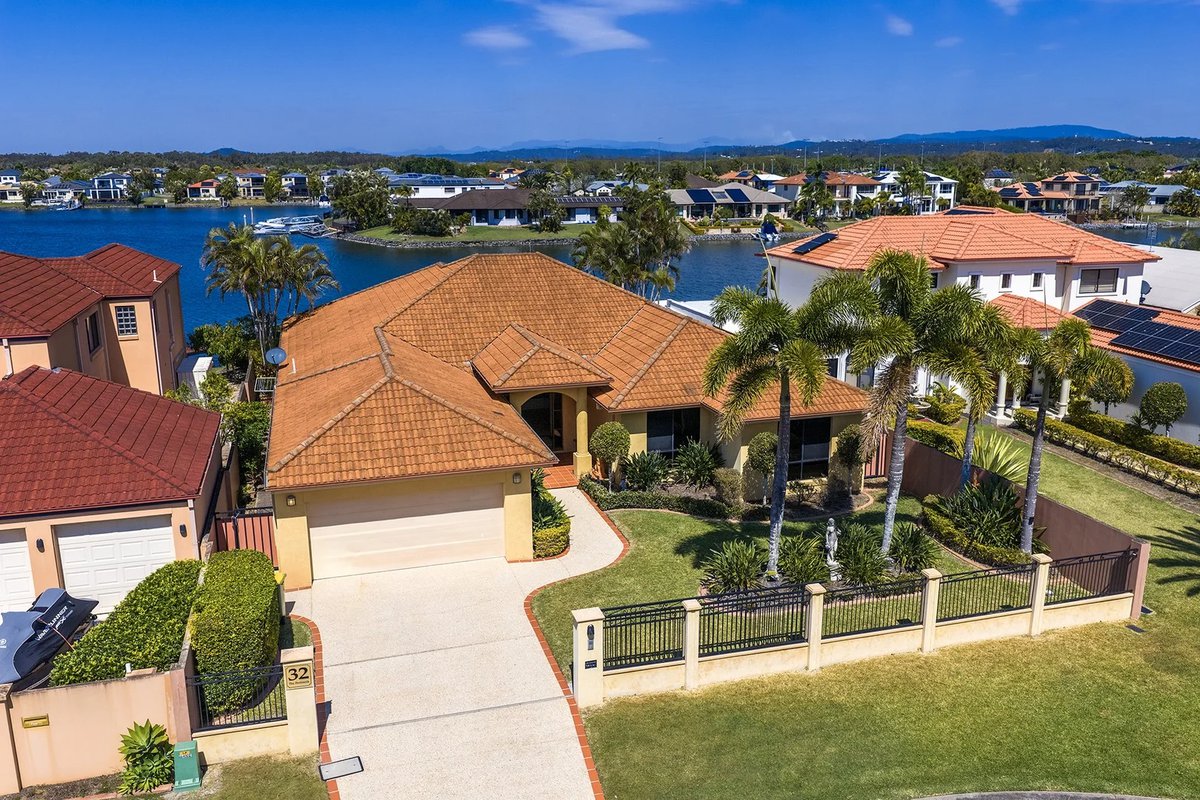
Helensvale
At a glance:
Helensvale is a thriving, master-planned suburb offering a complete lifestyle package. It features shopping centres, schools, golf courses, and convenient access to both the M1 and light rail. The suburb’s property market includes modern family homes, gated communities, and waterfront residences. Helensvale is a true all-rounder for families, professionals, and retirees.
Property Trends helensvale
| TYPE | MEDIAN PRICE | ANNUAL GROWTH | MEDIAN RENTAL PRICE | RENTAL YIELD |
|---|---|---|---|---|
| House | 1250000 | 11.6% | 1100 | 4.6% |
| Unit | 939000 | 7.3% | 750 | 4.2% |
Disclaimer: Median house and unit price is based on the number of sales within the last 12 months (Financial Year 2025). It is based on a rolling 12 month period and may differ from calendar year statistics. Annual growth is based on median price comparison over the last two rolling 12-month periods. Data source: AMP Pricefinder, Suburb Flyover Reports.
Growth Chart helensvale (Houses)
Property Trends arundel
| TYPE | MEDIAN PRICE | ANNUAL GROWTH | MEDIAN RENTAL PRICE | RENTAL YIELD |
|---|---|---|---|---|
| House | 1225000 | 16.1% | 930 | 3.9% |
| Unit | 805000 | 17.1% | 710 | 4.6% |
Disclaimer: Median house and unit price is based on the number of sales within the last 12 months (Financial Year 2025). It is based on a rolling 12 month period and may differ from calendar year statistics. Annual growth is based on median price comparison over the last two rolling 12-month periods. Data source: AMP Pricefinder, Suburb Flyover Reports.
Growth Chart arundel (Houses)
Property Trends pacific pines
| TYPE | MEDIAN PRICE | ANNUAL GROWTH | MEDIAN RENTAL PRICE | RENTAL YIELD |
|---|---|---|---|---|
| House | 1110000 | 13.8% | 870 | 4.1% |
| Unit | 748000 | 9.8% | 730 | 5.1% |
Disclaimer: Median house and unit price is based on the number of sales within the last 12 months (Financial Year 2025). It is based on a rolling 12 month period and may differ from calendar year statistics. Annual growth is based on median price comparison over the last two rolling 12-month periods. Data source: AMP Pricefinder, Suburb Flyover Reports.
Growth Chart pacific pines (Houses)
Property Trends hope island
| TYPE | MEDIAN PRICE | ANNUAL GROWTH | MEDIAN RENTAL PRICE | RENTAL YIELD |
|---|---|---|---|---|
| House | 1462500 | -2.5% | 1300 | 4.6% |
| Unit | 1022500 | 10.4% | 850 | 4.3% |
Disclaimer: Median house and unit price is based on the number of sales within the last 12 months (Financial Year 2025). It is based on a rolling 12 month period and may differ from calendar year statistics. Annual growth is based on median price comparison over the last two rolling 12-month periods. Data source: AMP Pricefinder, Suburb Flyover Reports.
Growth Chart hope island (Houses)
Recent Properties
Source: Suburb Flyover Report Series, APM Pricefinder. PRD does not give any warranty in relation to the accuracy of the information contained in this report. If you intend to rely upon the information contained herein, you must take note that the Information, figures and projections have been provided by various sources and have not been verified by us. We have no belief one way or the other in relation to the accuracy of such information, figures and projections. PRD will not be liable for any loss or damage resulting from any statement, figure, calculation or any other information that you rely upon that is contained in the material. Prepared by PRD Research © All medians and volumes are calculated by PRD Research. Use with written permission only. All other responsibilities disclaimed.