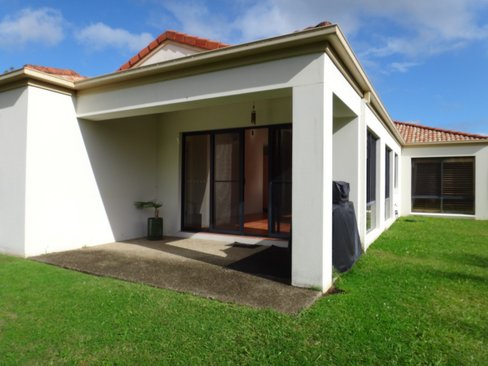
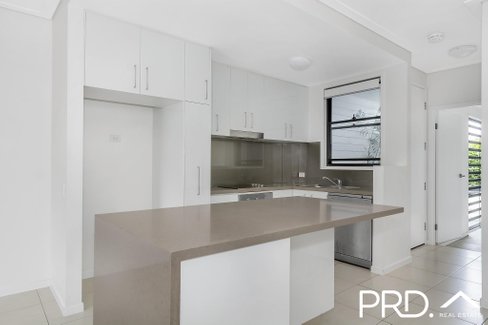
Hollywell
At a glance:
Hollywell is a peaceful coastal suburb known for its leafy streets, waterfront pathways, and strong nautical lifestyle. Homes for sale in Hollywell include low-maintenance houses, established family homes, and properties near the Broadwater. The area is sought-after by retirees and families looking for a quieter alternative to nearby busier suburbs. Its easy access to boat ramps, marine facilities, and scenic parks adds to the relaxed atmosphere. Hollywell’s consistent demand reflects its blend of tranquillity and coastal convenience.
Property Trends hollywell
| TYPE | MEDIAN PRICE | ANNUAL GROWTH | MEDIAN RENTAL PRICE | RENTAL YIELD |
|---|---|---|---|---|
| House | 1580000 | 15.1% | 850 | 2.8% |
| Unit | 1405000 | 8.1% | 850 | 3.1% |
Disclaimer: Median house and unit price is based on the number of sales within the last 12 months (Financial Year 2025). It is based on a rolling 12 month period and may differ from calendar year statistics. Annual growth is based on median price comparison over the last two rolling 12-month periods. Data source: AMP Pricefinder, Suburb Flyover Reports.
Growth Chart hollywell (Houses)
Property Trends coombabah
| TYPE | MEDIAN PRICE | ANNUAL GROWTH | MEDIAN RENTAL PRICE | RENTAL YIELD |
|---|---|---|---|---|
| House | 975000 | 1.0% | 750 | 4.0% |
| Unit | 740000 | 12.0% | 710 | 5.0% |
Disclaimer: Median house and unit price is based on the number of sales within the last 12 months (Financial Year 2025). It is based on a rolling 12 month period and may differ from calendar year statistics. Annual growth is based on median price comparison over the last two rolling 12-month periods. Data source: AMP Pricefinder, Suburb Flyover Reports.
Growth Chart coombabah (Houses)
Property Trends paradise point
| TYPE | MEDIAN PRICE | ANNUAL GROWTH | MEDIAN RENTAL PRICE | RENTAL YIELD |
|---|---|---|---|---|
| House | 2005000 | -8.9% | 1250 | 3.2% |
| Unit | 1345000 | -0.6% | 750 | 2.9% |
Disclaimer: Median house and unit price is based on the number of sales within the last 12 months (Financial Year 2025). It is based on a rolling 12 month period and may differ from calendar year statistics. Annual growth is based on median price comparison over the last two rolling 12-month periods. Data source: AMP Pricefinder, Suburb Flyover Reports.
Growth Chart paradise point (Houses)
Property Trends runaway bay
| TYPE | MEDIAN PRICE | ANNUAL GROWTH | MEDIAN RENTAL PRICE | RENTAL YIELD |
|---|---|---|---|---|
| House | 1905000 | 14.8% | 1200 | 3.3% |
| Unit | 930000 | 6.9% | 750 | 4.2% |
Disclaimer: Median house and unit price is based on the number of sales within the last 12 months (Financial Year 2025). It is based on a rolling 12 month period and may differ from calendar year statistics. Annual growth is based on median price comparison over the last two rolling 12-month periods. Data source: AMP Pricefinder, Suburb Flyover Reports.
Growth Chart runaway bay (Houses)
Recent Properties
Source: Suburb Flyover Report Series, APM Pricefinder. PRD does not give any warranty in relation to the accuracy of the information contained in this report. If you intend to rely upon the information contained herein, you must take note that the Information, figures and projections have been provided by various sources and have not been verified by us. We have no belief one way or the other in relation to the accuracy of such information, figures and projections. PRD will not be liable for any loss or damage resulting from any statement, figure, calculation or any other information that you rely upon that is contained in the material. Prepared by PRD Research © All medians and volumes are calculated by PRD Research. Use with written permission only. All other responsibilities disclaimed.