Southport Property Factsheet 1st Half 2018
Download Factsheet here:
Southport Property Factsheet 1st Half 2018
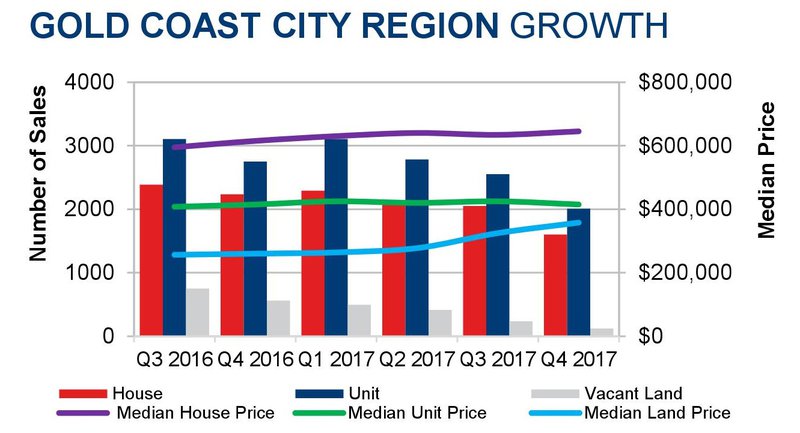
The Southport aggregate property market recorded a median house price of $581,750 and $370,000 for units in Q4 2017, representing an annual price change of 4.5% and 0.1% respectively. Over the same period of time (Q4 2016 - Q4 2017) house prices in the Gold Coast City region grew by 4.9% to $645,000 while unit prices remained stable at $415,000. This indicates Southport is an attractive option for both first home buyers and investors. When compared to the wider Gold Coast City region, Southport provides a combination of affordability and positive capital growth.
Between Q4 2016 and Q4 2017, average vendor discount for houses tightened to -4.4%, suggesting buyers are more willing to offer closer to first list asking price. The time for house owners to sell is now. Over the same period average discount for units have widened to -4.8% and average days on market has declined to 88 days. This indicates unit buyers are actively looking to secure their dream properties and sellers are slightly more willing to negotiate on first list asking price, facilitating a quicker sale turn over.
Median weekly rent in Southport has grown by 7.1% for houses (to $493 p/w) and by 1.3% for units (to $395 p/w) over the past 12 months to Q4 2017. Low average vacancy rates of 1.5% in December 2017 is similar to that of Gold Coast 1.2% which continues to demonstrate the strong rental demand in the area. Astute investors are benefiting from 4.4% (houses) and 4.9% (units) rental yield, similar to that of Gold Coast's 4.3% (houses) and 5.4% (units).
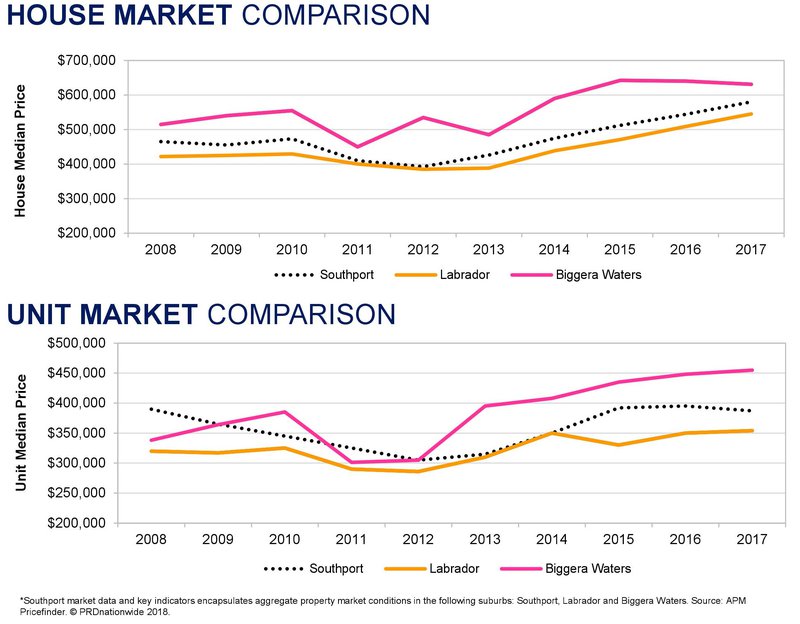
MARKET COMPARISON GRAPH
The market comparison graph provides comparative trend for median price of house and units over the past 10 years. Suburbs profiled are chosen based on proximity to Southport.
