Suburb Information
Gympie Property Insights & Local Market Data
Understanding how the market is performing is essential when making property decisions. Below you’ll find the latest data and insights for Gympie, Maryborough, Hervey Bay and the Cooloola Coast (Tin Can Bay & Rainbow Beach), including median prices, growth trends, rental returns and yield performance.
These suburb insights offer a clear snapshot of how each area is performing, whether you're selling in Gympie, investing in Maryborough, or exploring growth across the wider region.
Our team services all of these locations, along with surrounding areas, and can provide a tailored appraisal or strategy to suit your property and goals.
PRD Gympie Service Areas:
If a Suburb you are interested in is not covered below, please send a request to our friendly team.

Property Trends gympie
| TYPE | MEDIAN PRICE | ANNUAL GROWTH | MEDIAN RENTAL PRICE | RENTAL YIELD |
|---|---|---|---|---|
| House | 695000 | 17.8% | 575 | 4.3% |
| Unit | 540000 | 18.0% | 450 | 4.3% |
Disclaimer: Median house and unit price is based on the number of sales within the last 12 months (Financial Year 2026). It is based on a rolling 12 month period and may differ from calendar year statistics. Annual growth is based on median price comparison over the last two rolling 12-month periods. Data source: AMP Pricefinder, Suburb Flyover Reports.
Growth Chart gympie (Houses)
Property Trends maryborough
| TYPE | MEDIAN PRICE | ANNUAL GROWTH | MEDIAN RENTAL PRICE | RENTAL YIELD |
|---|---|---|---|---|
| House | 570000 | 20.0% | 520 | 4.7% |
| Unit | 405000 | 37.3% | 390 | 5.0% |
Disclaimer: Median house and unit price is based on the number of sales within the last 12 months (Financial Year 2026). It is based on a rolling 12 month period and may differ from calendar year statistics. Annual growth is based on median price comparison over the last two rolling 12-month periods. Data source: AMP Pricefinder, Suburb Flyover Reports.
Growth Chart maryborough (Houses)
Property Trends tin can bay
| TYPE | MEDIAN PRICE | ANNUAL GROWTH | MEDIAN RENTAL PRICE | RENTAL YIELD |
|---|---|---|---|---|
| House | 740000 | 5.7% | 520 | 3.7% |
| Unit | 462500 | -8.6% | 440 | 4.9% |
Disclaimer: Median house and unit price is based on the number of sales within the last 12 months (Financial Year 2026). It is based on a rolling 12 month period and may differ from calendar year statistics. Annual growth is based on median price comparison over the last two rolling 12-month periods. Data source: AMP Pricefinder, Suburb Flyover Reports.
Growth Chart tin can bay (Houses)
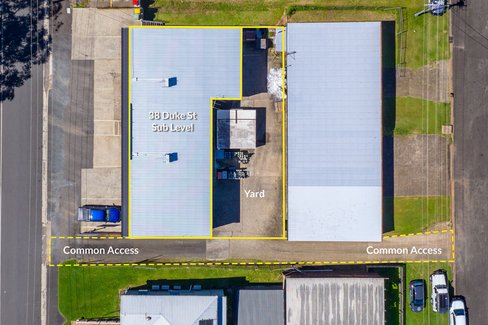
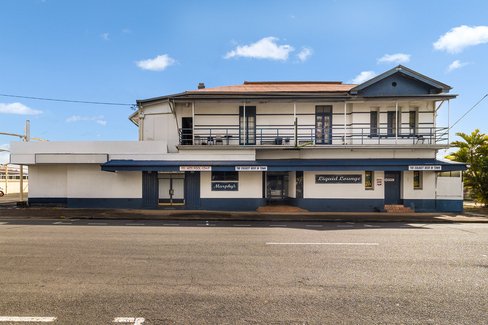
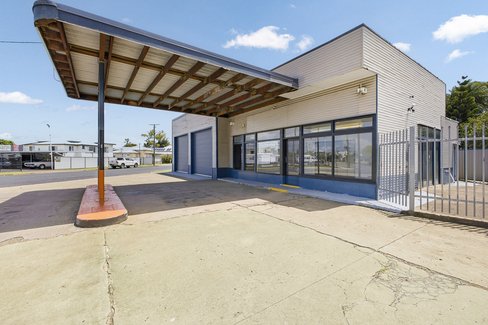
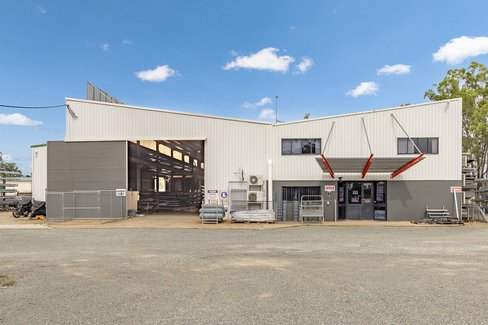
Recent Properties
Source: Suburb Flyover Report Series, APM Pricefinder. PRD does not give any warranty in relation to the accuracy of the information contained in this report. If you intend to rely upon the information contained herein, you must take note that the Information, figures and projections have been provided by various sources and have not been verified by us. We have no belief one way or the other in relation to the accuracy of such information, figures and projections. PRD will not be liable for any loss or damage resulting from any statement, figure, calculation or any other information that you rely upon that is contained in the material. Prepared by PRD Research © All medians and volumes are calculated by PRD Research. Use with written permission only. All other responsibilities disclaimed.