Affordable & Liveable Property Guides 2nd Half 2023
The PRD Affordable and Liveable Property Guides 2nd half 2023 are available for Brisbane, Sydney, Melbourne, Hobart, Gold Coast, and Perth. These guides provide valuable insights on property trends and how current economic conditions (including cash rate hikes) have impacted the market, as well as future developments for the next 6 months. For those looking for more affordable options (compared to the capital city metro area) these guides provide key suburbs that has passed the affordability, investment, and liveability criterias.
Key Findings
- It was incredibly challenging to find affordable and liveable suburbs in Brisbane and Gold Coast, especially when attempting to choose the lowest median property price possible. Crime rate, unemployment level, and ensuring a high level of project development were sticky points. This was more prevalent in the house market, thus first home buyers have more of an opportunity in the unit market.
- There was a consistent trend of sacrificing unemployment rate in favour of high project development value, with the assumption that a high level of commercial and infrastructure projects would stimulate local employment in the future. This is due to the incredibly tight labour market post-COVID-19 and extremely low unemployment rates. This was the case for Perth, Melbourne, Sydney, Adelaide, and Hobart.
- Compared to previous years, there was a significantly higher number of Sydney and Melbourne suburbs that did not meet the annual neutral or positive property price growth criteria. Although this discounts those suburbs for the purposes of this report, it also signals a time for first home buyers to enter the market. Sydney for example, 70 suburbs were not considered in the report due having negative price growth.
- With an incredibly tight rental market, vacancy rates in most capital city metro areas were already at a historical low, ranging up to 1.5%. Compared to the past 5 years this is not a normal rental market, which makes finding suburbs that has a lower or on-par vacancy rates challenging. This was found to be most obvious in Sydney.
- Hobart proved to be the most challenging city in regard to identifying suburbs with a high level of project development. For example, only 5 suburbs were eligible when choosing a suburb for units. Those who wishes to live in an area with development must be prepared to pay a sale price that is quite close to the Hobart Metro prices.
- Adelaide proved to be the capital city with the most numbers of suburbs to choose from, after the affordability and price growth criteria were applied. Thus, there were ample suburbs to choose form compared to other capital cities, which is good news for local first home buyers and interstate first time investors.
Cost of Liveability
Table 1 illustrates the difference between the required premium or discounts percentage that was added to the relevant state average home loan to reach:
a) the respective capital city metro median price
b) the chosen affordable and liveable suburbs which have met all other methodology criteria (i.e liveability, investment, and project development).
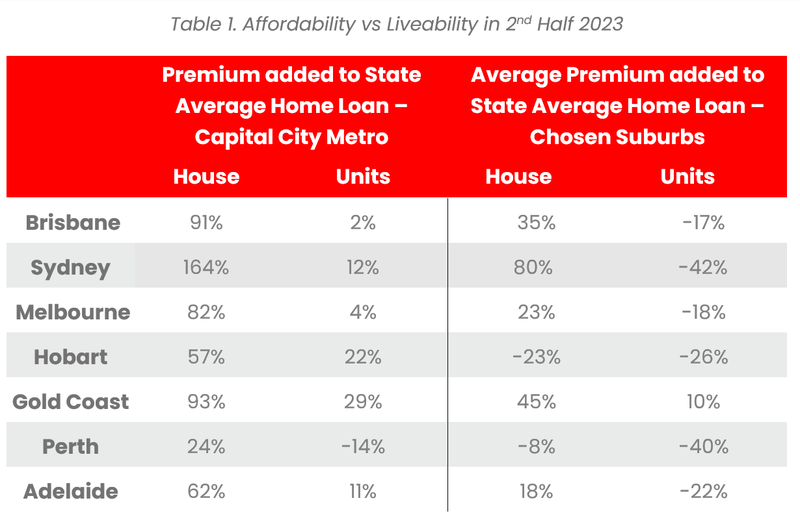
It is important to note that these premium percentages are affected by two key variables:
- median price movements in the general market of the relevant capital city
- the ability of a suburb to meet all affordability, investment, and liveable criteria (i.e., the suburb’s “readiness”).
For houses, Perth is the most affordable capital city for liveability, due to the softer nature of their property market and the high level of “readiness” of its suburbs. Buyers in a highly liveable suburb need to only add 5.0% to the Western Australian state average loan, not the 59.0% needed to reach the Perth Metro house price. Gold Coast is the most expensive city for liveability, as house buyers must add 48% to the Queensland state average loan.
For units, Adelaide proves to be the most affordable city for liveability. Buyers can benefit from a discount of -35% when accessing units in a chosen suburb, instead of needing to add 4% on top of the South Australian state average loan for a unit in Adelaide CBD. Hobart is the most expensive city for liveability, as buyers must add 5% on top of the Tasmania state average loan. This is mostly due to an absence of future projects in lower priced suburbs.
On the Eastern Seaboard, for houses, Melbourne is the most affordable capital city for liveability. House buyers in a highly liveable suburb need only to add 13.0% to the Victorian state average loan, not the 71.0% needed to reach the Melbourne Metro house price. For units Brisbane prove to be the most affordable city for liveability. Unit buyers can benefit from a discount of -24% when accessing units in a chosen suburb, higher than the -3% discount for unit buyers in Brisbane CBD.
Affordable & Liveable Suburbs
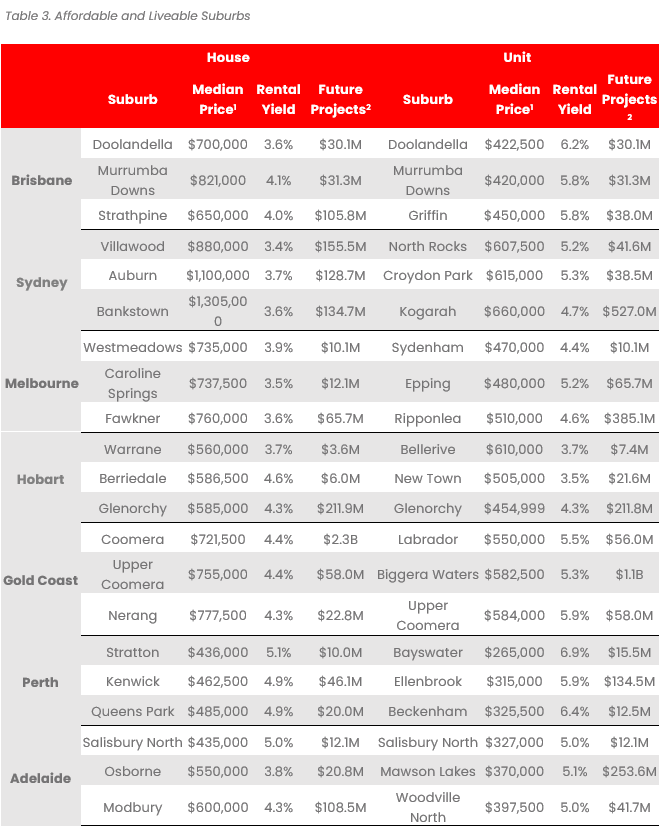
Table 3 identifies affordable and liveable suburbs that has met all methodology criteria.
Perth and Adelaide have the most affordable chosen suburbs. Sydney remains the most expensive capital city, whilst Hobart provide a middle-priced option. Interestingly Brisbane, Melbourne, and Gold Coast are now on par, which was not the case 2-3 years ago.
Methodology
Each Affordable and Liveable Property Guide focuses on suburbs within a 20km radius of the CBD (or 10km for Hobart), taking into consideration the following criteria:
- Property trends criteria – all suburbs have a minimum of 20 sales transactions (or 10 transactions for Hobart) for statistical reliability purposes. Based on market conditions suburbs have either positive, or as close as possible to neutral price growth between 2022 to 2023.
- Investment criteria – as of September 2023, suburbs considered will have an on-par or higher rental yield than the relevant City Metro area, and an on-par or lower vacancy rate. This ensures the chosen suburb has a more attractive investment prospect.
- Affordability criteria – identified suburbs have a median price below a set threshold. This threshold was set by adding a percentage premium to the respective state’s average home loan3. This percentage premium must result in a price threshold below the City Metro area’s median price in order to ensure affordability.
- Development criteria – suburbs identified must have a high total estimated value of future project development for the 2nd half of 2023, as well as a higher proportion of commercial and infrastructure projects. This ensures the suburbs show signs of sustainable economic growth, in turn positively affecting the property market.
- Liveability criteria – all identified suburbs have low crime rates, availability of amenities within a 5km radius (i.e. schools, green spaces, public transport, shopping centres and health care facilities), and an unemployment rate on-par or lower in comparison to the State average (as determined by the Department of Jobs and Small Business, June Quarter 2023 release).
You can download all the Affordable and Liveable Property Guides 2nd half 2023 below:
Affordable and Liveable Property Guides 2nd Half 2023 - Brisbane
Affordable and Liveable Property Guides 2nd Half 2023 - Sydney
Affordable and Liveable Property Guides 2nd Half 2023 - Melbourne
Affordable and Liveable Property Guides 2nd Half 2023 - Hobart
Affordable and Liveable Property Guides 2nd Half 2023 - Perth
Affordable and Liveable Property Guides 2nd Half 2023 - Gold Coast
Affordable and Liveable Property Guides 2nd Half 2023 - Adelaide