Lending Policy Squeezes Buyers

Highlights:
- The Home Loan Affordability indicator increasing by 4.5% over the past 12 months to March 2017
- The Time to Buy a Dwelling Index has decreased an average of 7.0% across the five states over the 12 months to March 2017
- Capital city markets continue to perform, with the highest growth for the 1st half 2017 reported in New South Wales (12.1%), followed by Victoria (11.4%)
- Throughout the annual period to May 2017, the five capital city aggregate values increased by 8.5%
- Regional Australia property growth proves to be sustainable, and in fact all states experienced positive growth for the 1st half of 2017
- The Australian economy recorded a 0.3% growth in the first three months of 2017, indicating a resilient economy
Get the full report
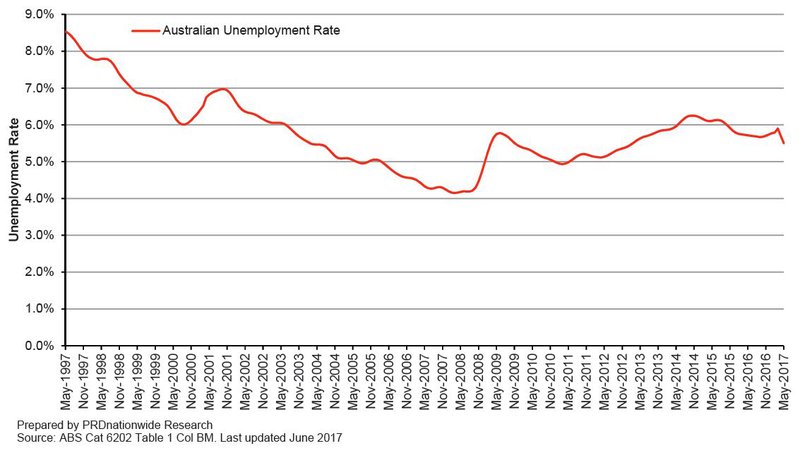
The Australian economy recorded 0.3% growth in the first three months of 2017, indicating a resilient economy as Australia transitions to lower levels of mining investment. Unemployment statistics have been relatively steady over the past 18 months, between the 5.9% and 5.7% range. Seasonally adjusted May 2017 unemployment rate is 5.5%, which is a 3.8% improvement over the past 12 months. This is a 10.0% improvement over the past 24 months, a positive outcome for the economy at large.
Australian Unemployment Rate
Population Growth
The Australian population experienced an annual growth rate of 1.5% over the 12 months from June 2015. The continuation of a growing population is likely to create more demand for property and absorb current residential developments in the short run.
Net overseas migration has increased by 8.0% in Australia. An increase in net overseas migration might result in faster population growth rates in the long run, impacting new housing and rental property demand in the future. Victoria continue to lead in annual population change, creating more opportunities for property demand and growth in the region.
The continuation of a growing population is likely to create more demand for property and absorb current residential developments in the short run.
Inflation (consumer price index) for all groups was recorded at 2.1% in March 2017, entering the Reserve Bank of Australia’s target range for the first time since December 2014. This is the highest inflation rate since September 2014, driven by a surge in certain sectors. In June 2017 the RBA decided to leave the cash rate at 1.5 points, a historical low for the past 10 consecutive months. Conditions in the housing market vary around the country, where there are signs that exponential growth is starting to ease.
Property Growth Map
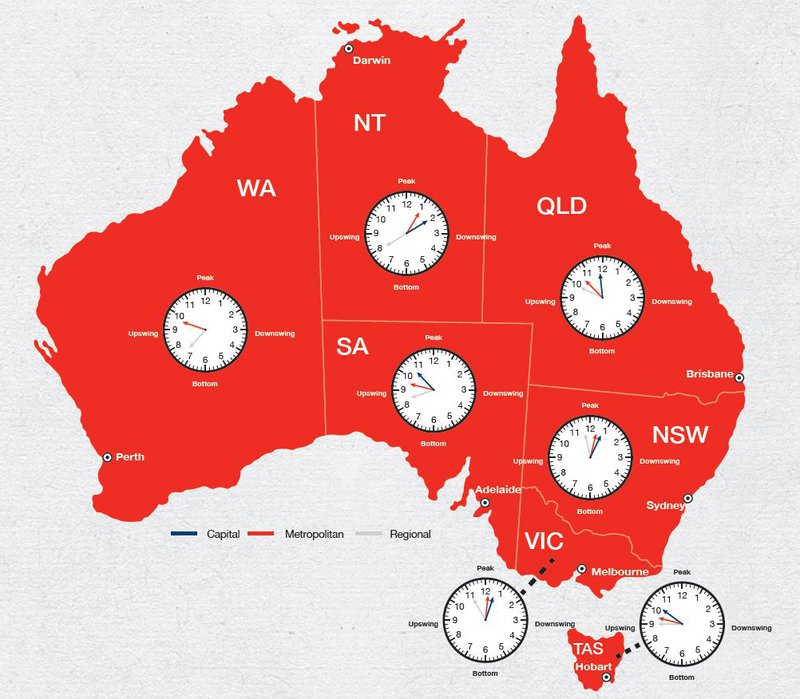
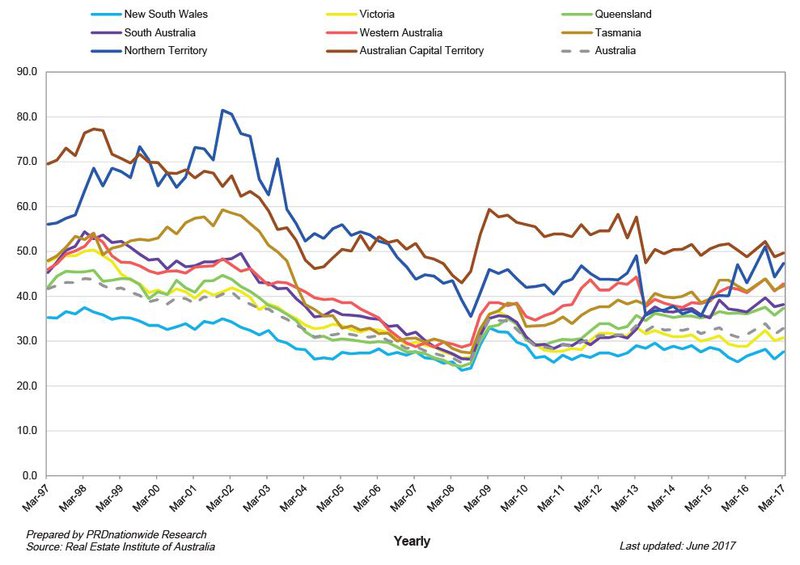
Capital City Markets
Capital city markets continue to perform, with the highest growth for the 1st half 2017 reported in New South Wales (12.1%), followed by Victoria (11.4%). Other metropolitan markets – Tasmania (8.1%), Northern Territory (3.6%), and Queensland (1.5%) also continue to record positive growth.
Metropolitan markets, except Western Australia, experienced growth although at a slower pace compared to the 2nd half of 2016. New South Wales, Northern Territory and Australian Capital Territory each recovered from declines a year prior, to record positive growth figures. This recovery suggests it would be hasty to declare that the market has hit its peak.
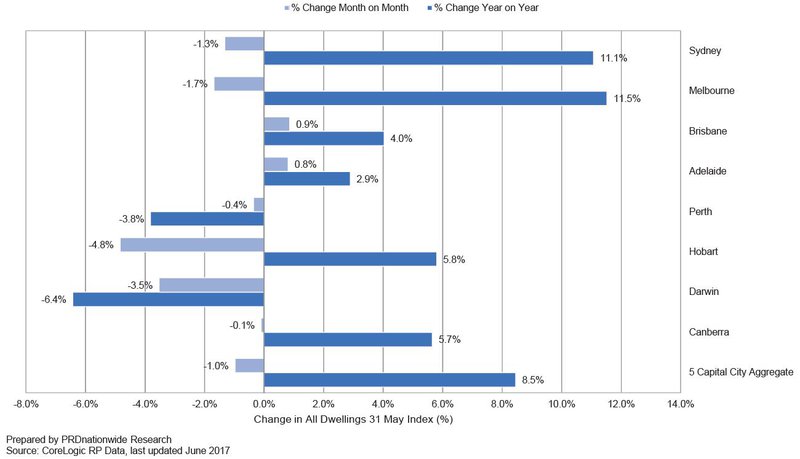
Throughout the annual period to May 2017, the five capital city aggregate values increased by 8.5%; although interestingly this marks a softening of 1.0% from the previous month. Melbourne and Sydney were the top performers with annual growth sitting at 11.1% and 11.5% respectively, however when compared to annual growth to May 2016 this is a slower level of growth, for previously it increased by 13.9% and 13.1%.
A similar trend can be seen in Brisbane, who despite showing continuous performance with year on year to May 2017 growth of 4.0%, has slowed from the May 2016 annual growth of 7.1%. Compared to May 2016 Brisbane no longer holds the third highest annual growth among the capital cities, instead Hobart and Canberra tie in this spot at 5.8% and 5.7% respectively.
Dwelling Home Value Index by Capital City
It seems that there is a cooling in the three main capital city markets, returning to the usual, and more sustainable, levels of strong growth that the market has witnessed prior to the property boom.
New listings in Brisbane, Adelaide and Perth declined over the past 12 months to May 2017, at -7.1%, -3.3% and -12.4%, respectively. Average time on market for all capital cities has displayed a declining trend over the past 12 months, by 24.2% for houses and 12.9% for units. Sydney and Hobart tied for the spot of lowest days on market, with houses sitting at 28 days in both capital cities and units sitting at 34 and 36 days respectively.
Regional Australia property growth proves to be sustainable, and in fact all states experienced positive growth for the 1st half of 2017. Queensland regional markets recorded the highest growth (4.0%) out of the three main states (NSW, VIC, and QLD). Average growth over the past 6 months to 1st half 2017 is 4.5%, which is higher than capital city (2.8%) and metropolitan (0.7%) average growth.
Regional Australia property growth proves to be sustainable
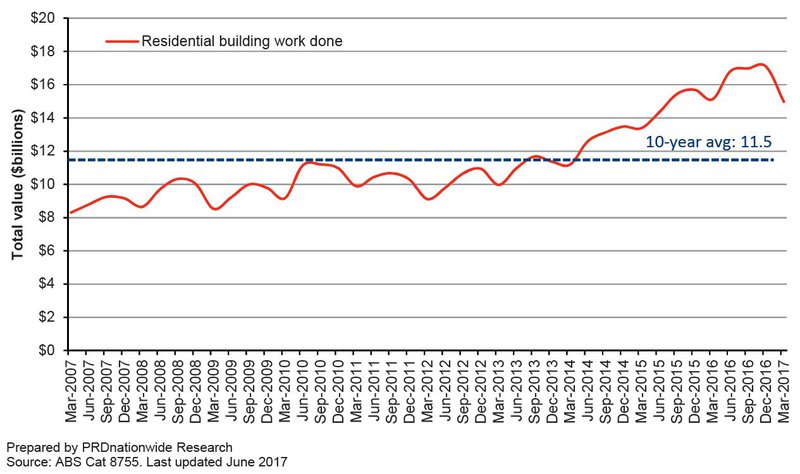
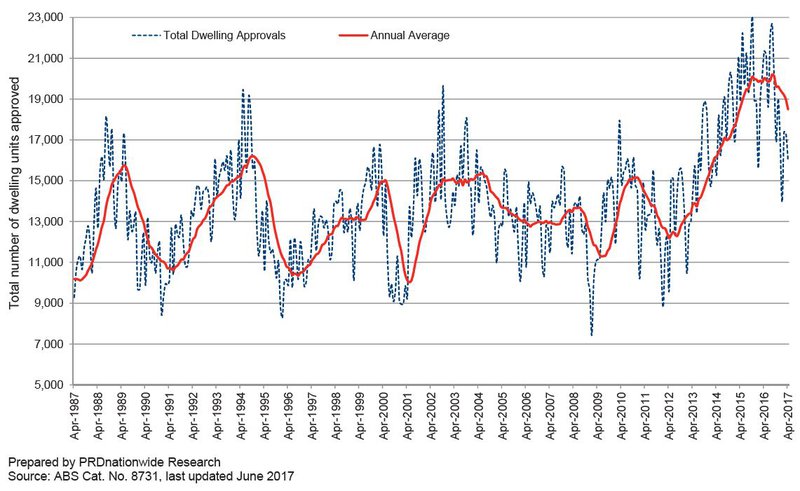
New residential construction declined by 11.8% over the past 6 months, after a period of record high between June and December 2016. Over the past 12 months new residential construction in NSW and VIC increased by 6.6% and 5.8% respectively, addressing the under-supply issue as a way to fix affordability concerns. Interestingly new residential construction in seemingly more affordable states of Queensland, South Australia, and Tasmania declined over the past 12 months; by 9.4%, 1.4%, and 11.7%; perceived as pre-cautionary tools in allowing market absorption.
Residential Construction Market
Dwelling Approvals
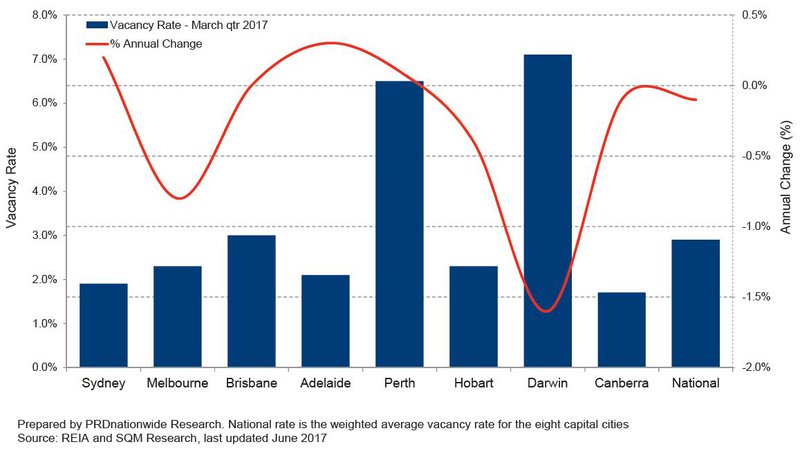
The average vacancy rate for all capital cities currently sits at 2.9% in March 2017, representing a 0.1% decrease over the past twelve months. This is good news for investors, as a decrease in vacancy rates suggests a healthier rental market and thus steady and/or increasing returns in investment. That said the increase is only marginal, suggesting that caution is still needed when making investment purchasing decisions.
Vacancy rates in Brisbane continues to hold stable over the past twelve months, at 3.0%. Melbourne recorded a vacancy rate of 2.3% in March 2017, which is an improvement (0.8%) from March 2016. In Canberra and Sydney rental markets are tight, with both contending for the lowest vacancy rate for all capital cities, at 1.7% and 1.9% respectively.
Housing Affordability
The word “affordability’ continue to be the headlining topic of political debates, media stories, property industry discussions, community engagements, and family BBQ conversations. There has also been an increasing shine on the widening gap between family income (stemmed from slow wage growth) and the level of mortgage debt serviced or rental payments made.
“Affordability” continues to be a headlining topic
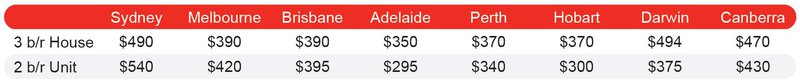
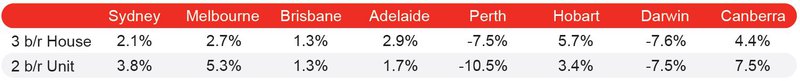
Over the past year, the median house rent for a three bedroom house increased in each capital city, except Perth and Darwin, which recorded decreases, down by 7.5% and 7.6%, respectively. Hobart recorded the highest growth in three bedroom house median rent (5.7%) and Canberra came second (4.4%). The largest growth for two bedroom unit rents was recorded in Canberra (7.5%), followed by Melbourne (5.3%). Sydney recorded a growth of 2.1% for three bedroom houses and 3.8% for two bedroom units.
Median Rental Price
Annual Percentage Change
Quarterly Vacancy Rate
Since June/July 2016, post Federal Election 2016, a few policies to address this were introduced by a variety of institutions. These were introduced by a myriad of enablers including, but not limited to: the Foreign Investment Review Board (FIRB), Banks, State Governments, Australian Prudential Regulation Authority (APRA), and Australian Tax Office (ATO). The purpose of these policies were simple: tighter policies to address concerns relating foreign buyers and investor activity, evening out the playing field for owner-occupiers and first home buyers.
The Home Loan Affordability indicator increasing by 4.5% over the past 12 months to March 2017
These efforts are starting to have some impact, with the Home Loan Affordability indicator increasing by 4.5% over the past 12 months to March 2017, currently at 32.9 index point. Out of the states that house Sydney Melbourne and Brisbane, Victoria had the highest increase in home loan affordability, at 6.5%. Interestingly both NSW and QLD reported 3.6% annual change. The proportion of family income needed to meet home loan repayments have decreased from 31.7% to 30.4% over the past 12 months to March 2017, whereas the proportion to meet rent payments have decreased from 25.1% to 24.6%.
Home Loan Affordability
That said many still blame the increasing, and seemingly uncontrolled, levels of domestic and foreign investment activity – and that these enablers (particularly the government) is not doing enough. The protest continues: owner-occupiers, particularly first home buyers, are outpriced and cannot fairly compete in an open market.
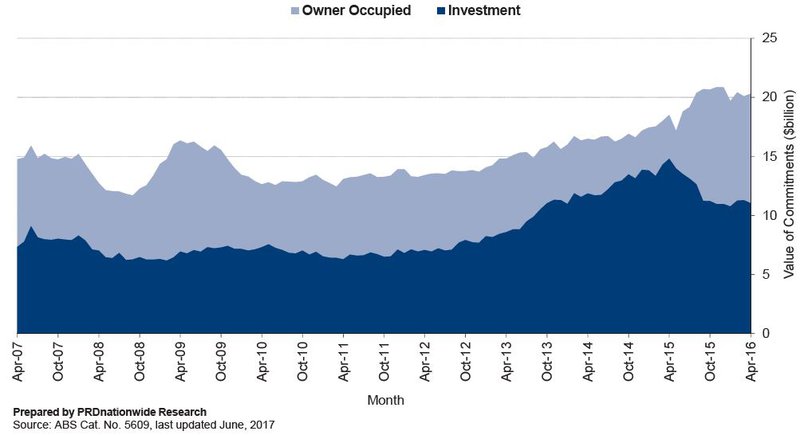
Owner occupiers have committed $120.1B to dwelling finance during the six months to April 2017, 0.2% up from the previous six months. Owner occupiers reflected 61.3% of housing finance commitments in April 2017, which represents a lesser amount of activity when compared to 64.8% share twelve months prior. Investor housing commitments saw an increase over the past six months to $78.3B, up by 8.4% compared to the previous half year.
Housing Finance Commitments
Time to Buy?
The Time to Buy a Dwelling Index has decreased an average of 7.0% across the five states over the 12 months to March 2017. South Australia recorded the steepest decline dropping by 21.3% over the past 12 months, followed by New South Wales which saw declines of 10.4%. Victoria rose the most of all states, inclining by 5.8%. Furthermore, the number of both first home buyers and loans has decreased, where they now make up only 13.4% of total owner-occupied housing.
The Time to Buy a Dwelling Index has decreased an average of 7.0% across the five states over the 12 months to March 2017
It is thus not surprising that a myriad of enablers – Federal and State government, APRA, banks, and the FIRB- are now even more so actively utilising tools within their policy toolkit to further dampen investor and buyer activity. Budget 2017 initiative on restricting foreign investor investment and ownership in newly built residential development may have short term adverse impact, as financing for new residential construction stall. This will have a varied impact on new dwelling supply across Australia – it will allow for absorption in already close to oversupplied inner CBD and metro areas, thus potentially correcting dwelling prices and returning it to more sustainable levels of growth. However it may stall supply in outer-metro and regional areas and cause price increases.
Enablers are also activating tools to increasingly assist first home buyers – for example the First Home Buyer Super Savers Scheme in Budget 2017, First Home Buyer super savings accounts in banks, continuation of first home buyer grants in most states, increased price range for stamp duty exemptions – in order to re-ignite the great Australian dream of home-ownership.
New policies proposed by enablers (Federal Government, APRA, Banks, etc) has come at the right time, considering the Australian Consumer Sentiment has fluctuated over the past 12 months.
Australian Consumer Sentiment
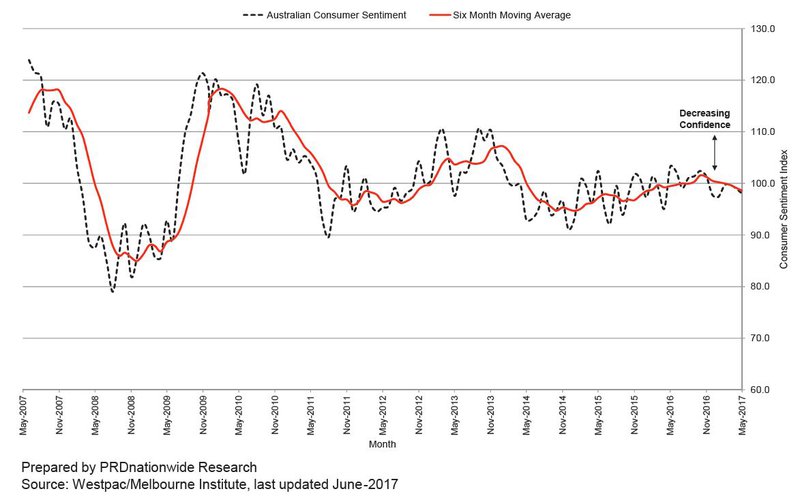
Australian consumer confidence continue to travel below the positive line in 2017, recorded at 98.0 index points in May 2017. Compared to twelve months ago consumer sentiment has decreased by 5.2 index points, from 103.2 index points in May 2016. This is interesting considering that the RBA has kept the historically-low cash rate stable, at 1.5% over the past ten consecutive months.
The release of the Federal Budget 2017 on 9th May has failed to immediately lift consumer confidence, with sentiment dropping by 1.1% between April and May 2017. Despite the Government promising significant spending on infrastructure, education, and health; 33.0% of families indicated their finances might be worse off over the next twelve months. That said a focus on tackling property affordability concerns through increasing housing supply and policies geared for first home buyers should start to see consumer sentiment lift.
Australian consumer confidence continue to travel below the positive line in 2017
Australian consumer confidence continue to ping from being optimistic and pessimistic in a matter of 30-60days. This suggests that consumers are wanting to be optimistic about economic outlook but are cautious – just hovering by a couple of index points below the positive line over the past 6 months.
It will be interesting to observe how the action of key enablers such as the Federal and State government, APRA, banks and the FIRB will continue to impact traditional investor and buyer activity from their policy toolkits.
The likely outcome should see a ‘soft landing’ for the market with prices settling back to sustainable solid single digit growth in the major east coast markets. This should increase the opportunity for a broader base of first home buyers to enter the market.
About the Australian Economic and Property Report
PRD’s Australian Economic and Property Report 2017 is a comprehensive and important resource for those wanting to keep up to date on key economic and property market trends that are evolving. Now in its 10th edition, the report provides a thorough update and analysis on property growth, consumer and business confidence, macroeconomic climate, foreign exchange and commodity prices, labour market, construction market, house finance, dwelling market, dwelling prices, home affordability, rental market, and demographics. The report is equipped with “traffic lights” signals to indicate the health of market conditions and a “What Does This Mean for You” section to highlight what each economic and/or property key indicator could mean for you.
The Australian Economic and Property Report 2017 was prepared and released shortly after the delivery of Federal Budget 2017 and during the final stages of State-level Budgets being announced. As such the Australian Economic and Property Report 2017 is highly focused on associated policy/policies designed to address the current status of each key economic indicator.
For more information on the Australian Economic and Property Report 2017 contact research@prd.com.au