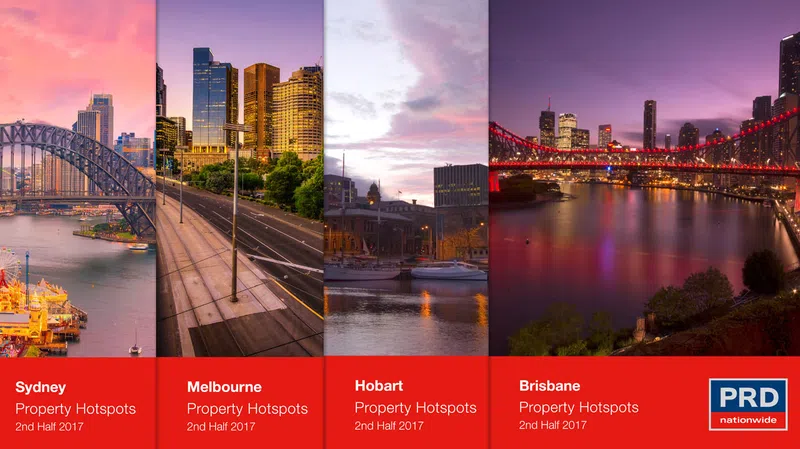
National Hotspots - 2nd Half 2017
The PRD capital hotspots report provides valuable insight and highlights for the market, reporting on a number of key indicators to create a holistic picture of the property conditions in each capital city. Each report focuses on suburbs within a 20km radius of the CBD, taking into consideration the following factors:
- Sales indicators - the number of sales transactions and median price growth between 2016 and 2017.
- Rental and investment indicators - median rental price, rental yield, and vacancy rates.
- Affordability - the average home loan of the relevant state, which indicates the amount that banks are comfortable with in approving for mortgage loans. We add a percentage premium to this amount to indicate the maximum property price considered to be affordable.
- Projects value - developments scheduled to commence in the 2nd half of 2017, which include mixed-use, infrastructure, industrial, and residential projects. This is key to maintaining growth as it indicates a potential increase in economic and commercial activity; as well as interconnectivity to key transport routes, the CBD, and other major urban business hubs. The PRD capital city hotspots are available for Sydney, Melbourne, Brisbane, and Hobart.
The Sydney metro area house median price has experienced a slower growth of 0.8% over the past 9 months from 2016 to Q3 2017. The unit market has softened by -2.5% within the same time frame, indicating that both house and unit prices in the metro market are beginning to pivot towards a more sustainable rate of growth. While there are concerns of affordability, there is evidence of relief, with specific affordable hubs emerging in the south-west region.
In 2017 the Melbourne property market saw unit prices begin to level out after a period of steady growth, while houses continue to benefit from an increasing Victorian population, unchanged cash rate, and sustained demand. Property buyers will be buoyed by the presence of affordable options, found especially to the north and east of the inner CBD.
Brisbane City’s house median price experienced 1.5% growth over the past 9 months from 2016 to Q3 2017, whilst unit prices softened by -2.2%. The threat of units oversupply in Brisbane is becoming evident, which in a way is good news for first home buyers wanting to enter the property market due to increased affordability. Southern suburbs recorded the strongest positive price growth of 9.4% for houses and 2.1% for units while the northern suburbs lead to house price growth of 5.0%.
Hobart’s property market continues to demonstrate its ever-increasing success with 5.1% annual growth over the past 9 months from 2016 to Q3 2017 and is set to maintain this trend into 2018. With house and unit prices beginning to hit their strides in their respective upswing stages, and the rental market performing strongly, investors are continuing to find ample opportunities in the market. North Hobart has come out as the strongest performer in 2016 – 2017, recording 37.7% growth.
A main contrast between the capital city hotspots in relation to affordability is reflected in a house median prices, in particular, the percentage of the market accessible to buyers with a certain budget within 20km from the CBD. In Brisbane for instance, buyers with a maximum budget of $500,000 can access approximately 10.6% of the market, and buyers with the same budget in Melbourne can access only 11.2%, which is considerably more when compared to Sydney (0.0%). That said there has been a decrease in Brisbane’s affordability, as the Brisbane 1st Half 2017 report identified buyers with a maximum budget of $500,000 can access 15.3% of the market.
Buyers would need a budget of $1M-$2M to access most of Sydney’s house market (51.6%), however approx. 37.5% of the market can be accessed by buyers with a budget of $500k-$800K in Melbourne and most buyers in Brisbane (52.9% of the market) only need a budget of $500k-$800K. This demonstrates the contrast of affordability the three capital city markets.
Below is a list of the house top 3 highest priced suburbs from each capital city, inclusive of percentage price change over 2016-2017 and rental yields. In light of affordability concerns, this potentially explains the current surge of Melbourne and Sydney investors into Brisbane and Hobart, on the basis of lower entry price (even at the high-end market) for a similar level of rental yield and capital growth.
Table 1: Top 3 Highest Priced Suburbs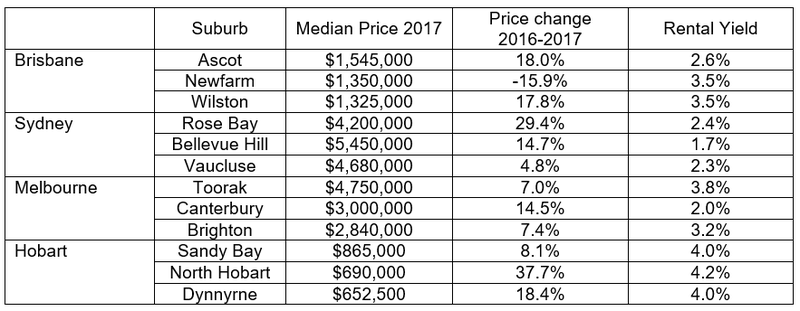
The PRD capital city hotspots series aim to identify hotspots within 20km from each capital city’s CBD, highlighting areas that are considered affordable based on the average home loan for each state. Each of the areas identified has demonstrated strong property related indicators such as price growth, vacancy rates, and rental yield; liveability in the form of amenities, and strong fundamentals for future sustainable growth based on planned development. These hotspots are:
Table 2: Affordable Hotspot Suburbs
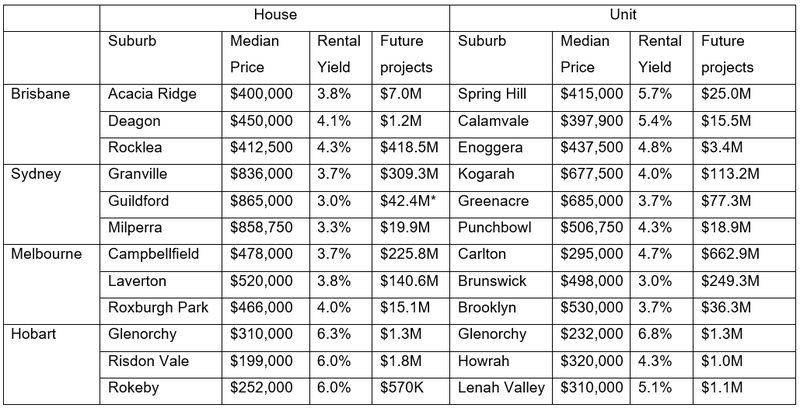 *Indicates projects in a neighbouring suburb, which will have a spill-over positive effect on to nominated suburb.
Affordability once again became contrasting key findings when identifying the above hotspots, as in order to identify areas based on current median price movement a different percentage premium had to be added to each state average home loan. For Brisbane, 40% premium (30% was added in Brisbane 1st Half 2017 report was added; which was in contrast to Sydney whereby 90% (85% was added in Sydney 1st Half 2017 report) premium had to be added. 40% premium was added in Melbourne and 40% premium added in Hobart (no change from Melbourne 1st Half 2017 and Hobart 1st Half 2017 reports).
From Table 2 Affordable Hotspots it is evident that, in general, Sydney has the highest entry price yet the lowest rental yield; whereas Hobart provides the lowest entry price with the highest rental yield.
Each capital city has a significant amount of project development planned for the 2nd half 2017, comprising of residential, mixed-use developments, commercial, industrial, and infrastructure projects.
Sydney’s 2nd half 2017 development total is $10.7B6, with the main concentration in increasing residential stock through mixed-use developments ($4.5B). This will assist in relieving continuous high demand for residential properties, with the hope of driving Sydney price growth into a more sustainable level of growth – in other words, more affordable for its residents. Over $5.1B of development is scheduled for Brisbane, with infrastructure projects being the main focus at $1.8B. This is extremely needed to ensure more connectivity to Brisbane CBD (for many jobs are still focused in the one spot) whilst residents start to move out beyond the within 20km from CBD suburbs to find affordable housing options.
Melbourne continues to demonstrate its economic growth potential with over $10.3B7 earmarked to commence in the second half of 2017. Infrastructure is a key area of focus ($6.1B or 59.8%) that underpins Melbourne’s strategic pathway to support its growing population.
Hobart’s property market is buoyed to receive spillover benefits from over $160.9M7 of new project earmarked to commence in the 2nd half of 2017. Commercial projects have emerged as the focus, ensuring local job growth. Hobart suburbs will benefit from increased infrastructure ($47.2M worth of new developments), and investors and property buyers will enjoy more quality stock coming into the market with $15.3M worth of residential projects earmarked to commence during the 2nd half of 2017.
Ensuring that there is a healthy level and mix of future developments is crucial for each capital city, in order to support population growth and also increase economic growth potential. This will have a positive spill-over effect on the property industry, ensuring a sustainable level of capital growth in the medium and long-term future.
For further information on each PRD Capital City 2nd half 2017 Hotspot Series, please contact research@prd.com.au.
Please follow the links below to view the reports:
Brisbane Hotspots 2nd Half 2017
Sydney Hotspots 2nd Half 2017
Melbourne Hotspots 2nd Half 2017
Hobart Hotspots 2nd Half 2017