Affordable & Liveable Property Guides 1st Half 2022
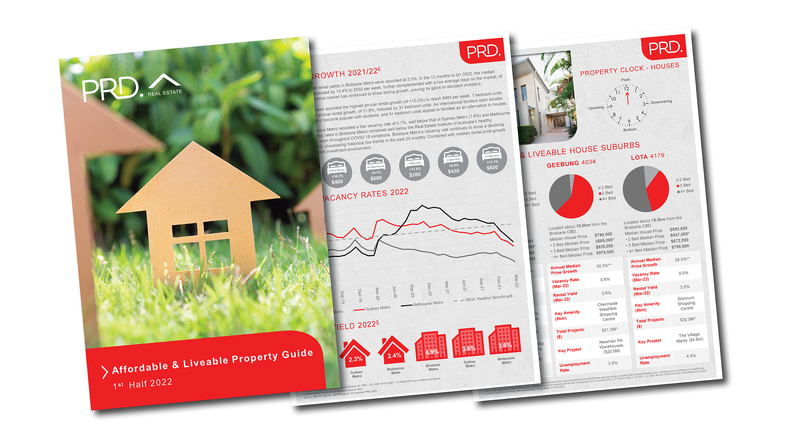
The PRD Affordable and Liveable Property Guides 1st Half 2022 are available for Brisbane, Sydney, Melbourne, Hobart and Gold Coast. These guides provide valuable insights and highlights of the property market and report on many key indicators to create an holistic picture of the property conditions in each capital city.
Download reports:
Affordable and Liveable Property Guide 1st Half 2022 - Brisbane.
Affordable and Liveable Property Guide 1st Half 2022 - Gold Coast
Affordable and Liveable Property Guide 1st Half 2022 - Sydney
Affordable and Liveable Property Guide 1st Half 2022 - Melbourne
Affordable and Liveable Property Guide 1st Half 2022 - Hobart
Key Findings
- Sydney and Melbourne are becoming opportune markets for buyers and in particular first home buyers, with median property price growth either slower than the previous 2nd Half of 2021 report (Sydney) or having swung to a decline (Melbourne). This is supported by a lower average vendor premium compared to the past 12 months and a growing most affordable price bracket (relevant to each capital city) that is available to buyers.
- Brisbane has usurped Sydney and Melbourne in regards to median property price growth, recording a continuously higher level of growth compared to the previous 2nd Half of 2021 report. An undersupply is evident in Brisbane Metro, particularly for houses. The Olympics 2032 announcement brought a certain buzz into Brisbane’s property market, and with border openings this trend is expected to continue.
- Hobart has eclipsed Sydney, Brisbane, and Melbourne for the title of a seller’s market. To secure their dream properties Hobart buyers need to offer the highest average vendor premium when compared to other capital cities, for both houses and units. This has been a consistent pattern for Hobart over the past 12 months. Comparatively, other capital cities are seeing a declining pattern in average vendor premium, or a swing towards average vendor discount.
- The Gold Coast market is moving at two speeds. The house market shows continued growth, however at a slower rate compared to 6 months prior. In contrast, the unit market is showing a higher pace of growth, fuelled by a deeper undersupply. The Gold Coast Metro premium market has grown exponentially. Affordable options are available, but have shrunk in the past 12 months, especially for houses (by half).
Cost of Liveability
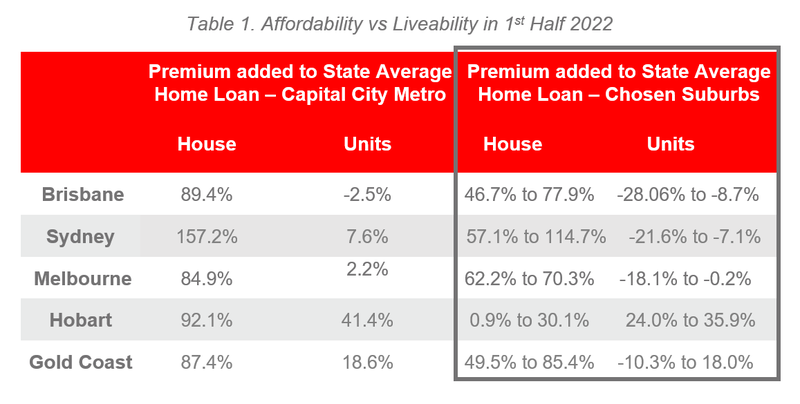
Table 1 illustrates the difference between the required premium percentage that is added to the relevant state average home loan3 to reach:
- the respective capital city metro median price
- the chosen affordable and liveable suburbs which have met all other methodology criteria (i.e liveability, investment and project development).
It is important to note that these premium percentages are affected by two key variables:
- median price movements in the market, and
- the ability of a suburb to meet the liveable criteria
For houses, the cost of liveability was the highest in Melbourne. Melbourne house buyers had to pay a similar percentage premium (added to the Victoria average home loan) between one of the “affordable and liveable” chosen suburbs and Melbourne Metro itself. This was due to the unemployment rate criteria, wherein a chosen suburb must have an unemployment rate of either lower or on par to the average Victoria unemployment rate.
This is potentially an after-effect of Melbourne being the capital city that has experienced the most severe and prolonged COVID-19 lockdowns, and is still in labour force recovery. This is also potentially due to many Melburnians deciding to move away from the CBD. Now that the property prices in Melbourne have turned and back-to-office is the new norm, there is a potential for more people to come back to the city and respond to job vacancies.
For units, the cost of liveability was the highest in Hobart. Hobart unit buyers must pay a similar percentage (added to the Tasmania average home loan) for a chosen “affordable and liveable” suburb and Hobart Metro itself. This was due to two reasons; lower-priced suburbs either a) had high unemployment rates or b) lacked future project developments.
An absence of residential projects has been an underlying issue for Hobart, a root cause for why the cost of liveability is higher than other capital cities / Metro areas. The is even more undersupplied in the 1st Half 2022, compared to the 2nd Half 2021ϖ report. A total of 99 units, 33 townhouses and 33 dwellings are planned for the 1st half 2022, located in various parts of Hobart. This will replenish supply and answer some of the pent-up demand.
Access to Market
The analysis of price point sales or access to market highlights significant findings.
Firstly, Brisbane can no longer hold its title as a haven for first home buyers, a title held all throughout 2021. In the 2nd Half 2021ϖ, Brisbanites with a budget classified as lower and lower-mid could access 27.7% of the market. In the 1st Half 2022 they can only access 18.3% of the market.
Secondly, both Sydney and Melbourne have become a friendlier capital city to first home buyers. This is due to slower paced price growth in Sydney and a turn in Melbourne’s prices. In the 2nd Half 2021 report, buyers with a budget classified as lower and lower-mid could access 19.2% (Sydney) and 13.6% (Melbourne) of the market. This has remained relatively on par for Sydney in the 1st Half 2022 at 18.0%, but increased for Melbourne to 16.3%.
Thirdly, the Hobart premium market continues to flourish, leaving little room for first home buyers or those with a budget classified as lower and lower-mid. The 2nd Half 2021ϖ report saw 46.8% (houses) and 25.7% (units) making up the premium market. This has increased to 60.0% for houses in the 1st Half 2022 and to 42.1% for units. Conversely, buyers with lower and lower-mid budgets can now only access 10.0% of the house market, compared to 14.9% in the 2nd Half 2021 report.
Lastly, Gold Coast is the least friendly market for first time unit buyers. Those with a budget classified as lower and lower-mid can only access 1.5% of the Gold Coast unit market, significantly lower than Sydney (33.7%) and Melbourne (21.1%). This is due to a deep undersupply in the market.


Affordable & Liveable Suburbs
Considering all methodology criteria (property trends, investment potential, affordability, project development and liveability), Table 4 identifies key affordable and liveable suburbs.
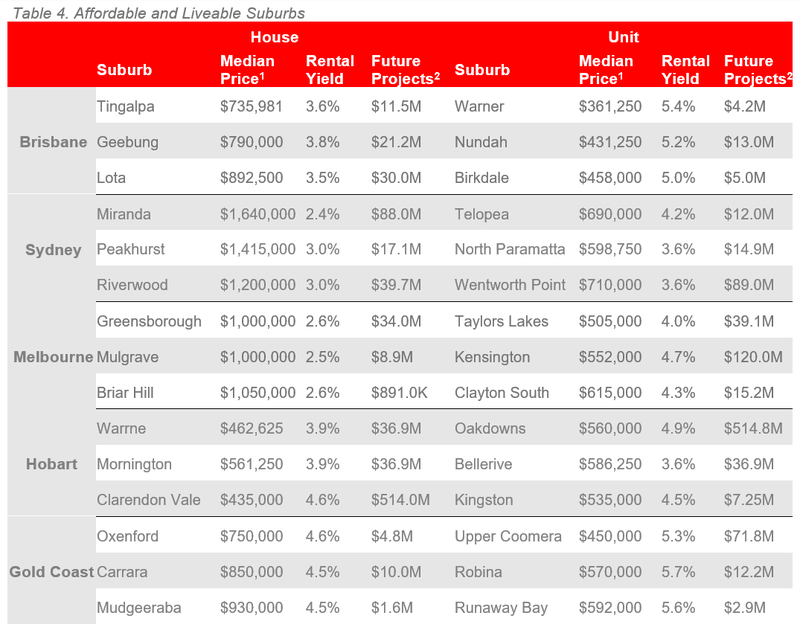
Sydney and Melbourne continue to be the most expensive capital city from a median price perspective, with the lowest rental yield. However this is only true for houses due to current undersupply in the market. There is a change in the unit market wherein some “affordable and liveable suburbs” have a similar median price with other capital cities known to be less expensive. Examples include North Paramatta in Sydney having a similar median unit price with Runaway Bay in the Gold Coast, and Taylors Lakes in Melbourne having a lower median unit price compared to all of the “affordable and liveable unit suburbs” in Hobart.
Despite having a growing premium market, Hobart and Brisbane continue to be the capital cities for “bang for buck”, however for different categories. Hobart’s “affordable and liveable” chosen suburbs for houses prove to have the lowest median price between the five Metro areas, whereas for Brisbane this title goes to the unit market. For Brisbane this is due to the oversupply of units back in 2017/18, which are currently being absorbed by buyers who are priced out of the house market.
Methodology
Each Affordable and Liveable Property Guide focuses on suburbs within a 20km radius of the CBD (or 10km for Hobart), taking into consideration the following criteria:
- Property trends criteria – all suburbs have a minimum of 20 sales transactions (or 10 transactions for Hobart) for statistical reliability purposes. Based on market conditions, suburbs have either positive or as close as possible to neutral price growth between between 2020 to 2021/221.
- Investment criteria – as of March 2022, suburbs considered will have an on-par or higher rental yield than the relevant capital city Metro area and an on-par or lower vacancy rate.
- Affordability criteria – This was determined by the percentage premiums that needed to be added to the respective state’s average home loan3. This percentage premium added to reach the suburb’s median house or unit price must be below the percentage premium needed to reach the relevant capital city Metro’s median price. This ensures that the chosen suburbs in the report are more affordable for buyers.
- Development criteria – suburbs identified must have a high total estimated value of future project development for the 1st half of 2022, as well as a higher proportion of commercial and infrastructure projects. This ensures the suburbs show signs of sustainable economic growth, in turn positively affecting the property market.
- Liveability criteria – all identified suburbs have low crime rates, availability of amenities within a 5km radius (i.e. schools, green spaces, public transport, shopping centres and health care facilities), and an unemployment rate on-par or lower in comparison to the relevant State average (as determined by the Department of Jobs and Small Business, December Quarter 2021 release).
You can download all the Affordable and Liveable Property Guides 1st Half 2022 below:
Affordable and Liveable Property Guide 1st Half 2022 - Brisbane.
Affordable and Liveable Property Guide 1st Half 2022 - Gold Coast
Affordable and Liveable Property Guide 1st Half 2022 - Sydney
Affordable and Liveable Property Guide 1st Half 2022 - Melbourne
Affordable and Liveable Property Guide 1st Half 2022 - Hobart


