Affordable & Liveable Property Guides 2nd Half 2022
The PRD Affordable and Liveable Property Guides 2nd Half 2022 are available for Brisbane, Sydney, Melbourne, and Hobart. These guides provide valuable insights of the market and report on many key indicators to create a holistic picture of property conditions in each capital city.
Key Findings
- Selected affordable and liveable suburbs in Sydney and Melbourne no longer report double-digit median price growth; instead, they report single-digit growth. The market has slowed down because of repeated cash rate increases and declining customer confidence. In contrast, Hobart's market has continued to show double digit growth rates due to a significant supply and demand imbalance.
- An increasing number of suburbs with negative growth were evident in all capital cities. For instance, in Melbourne, more than 20 suburbs were excluded because the median house price fell between 2021 and 2022, while more than 60 suburbs had negative increase in the median unit price. First-time home purchasers now have new opportunities as a result.
- Many State Governments have recorded a historically low unemployment rate as a result of a tight labour market. Due to this, many suburbs struggled to meet the criteria of having an unemployment rate lower than their state. As a result, project development values were occasionally prioritised because they can encourage the creation of local jobs in the near future.
Cost of Liveability
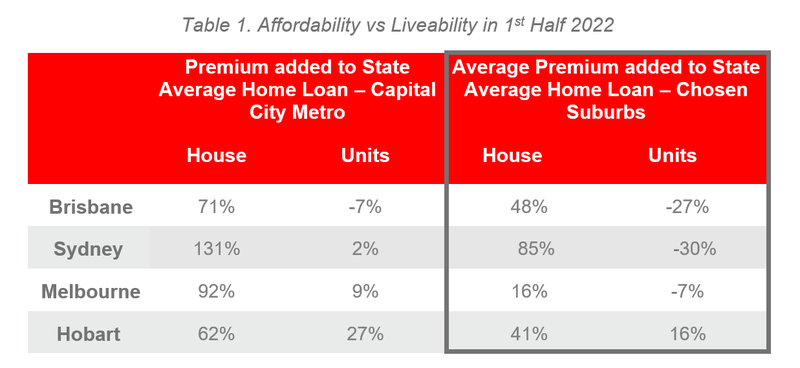
Table 1 illustrates the difference between the required premium percentage that is added to the relevant state average home loan3 to reach:
a) the respective capital city metro median price
b) the chosen affordable and liveable suburbs which have met all other methodology criteria (i.e., liveability, investment, and project development).
It is important to note these premium percentages are affected by two key variables:
- median price movements in the market, and
- the ability of a suburb to meet the liveable criteria.
Melbourne has become the most affordable capital city for houses due to a softening in its property market. Anyone wishing to buy a home in a highly liveable suburb must only add 16.0% to the Victorian state average loan, as opposed to adding 60.0% to reach the Melbourne Metro house price. This represents a substantial improvement over the first half of 2022 report, when a buyer would have had to pay an additional 62.2% on top of the average loan for the state of Victoria. Affordability has returned to Melbourne, creating new opportunities for buyers.
In a similar vein, Sydney has emerged as the most liveable capital city in terms of unit prices. Again, this is a result of the softening in its market. Sydney unit buyers can take advantage of a -30.0% reduction off the New South Wales state average. In comparison to Brisbane and Melbourne, this discount is substantially higher. In contrast, Hobart is the most costly, requiring purchasers to borrow an additional 16.0% over the average loan in Tasmania.
Access to Market
The analysis of price point sales, or access to market, highlights significant findings.
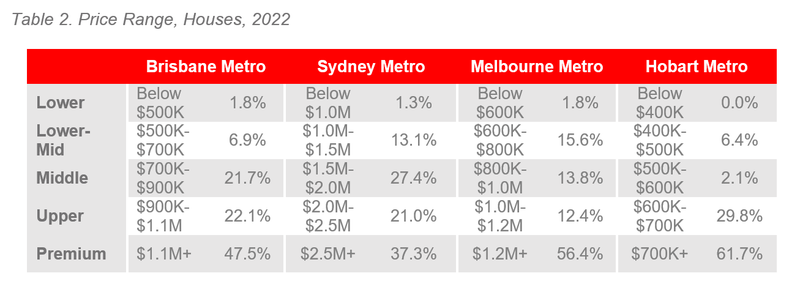
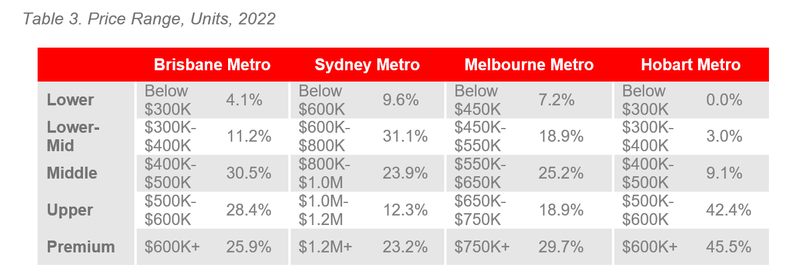
First, first home buyers looking for the most affordable opportunities have a greater chance in Sydney and Melbourne. This is from a comparative price-band perspective rather than a dollar value perspective. First home buyers have a 9.6% chance in Sydney’s most affordable price bracket, the highest of all capital cities, compared to a 0.0% chance in Hobart.
Second, from a comparable price-band standpoint, Hobart Metro dominates the premium market. In Hobart Metro, 61.7% of home sales and 45.5% of unit purchases took place in the premium market. This is nearly twice as much as the premium house (37.3%) and unit sales (45.5%) in Sydney Metro. This highlights the significant affordability issue in Hobart Metro, which is most likely due to the lack of new property stock entering the market in 2022.
Finally, Sydney and Melbourne's lower-mid and middle-priced markets have expanded even further. The middle price range for houses in Sydney and Melbourne accounted for 25.2% and 13.2% of sales, respectively, in the first half of 2022. In the 2nd half of 2022 report, this increased to 27.4% and 13.8%, respectively. On the contrary, it declined for Brisbane and Hobart, from 26.5% and 26.2%, respectively, in the 1st half of 2022 report, to 21.7% and 2.1%, respectively, in the 2nd half of 2022 report.
Affordable & Liveable Suburbs
Considering all methodology criteria (property trends, investment potential, affordability, project development, and liveability), Table 4 identifies key affordable and liveable suburbs.
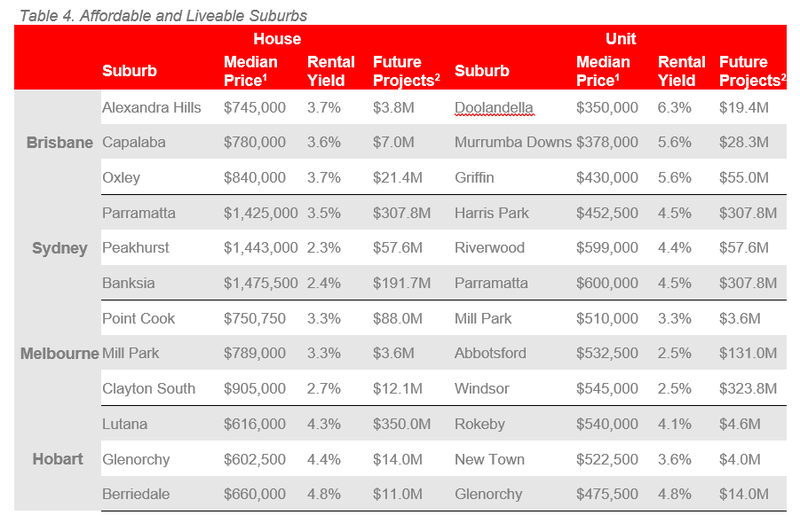
In terms of median price, Sydney is still the most costly capital city for homes It's interesting to note that Brisbane and Melbourne's median home prices are quite similar, which presents a dilemma for the citizens of each capital city. Given that Brisbane was once referred to as Melbourne's "little brother," affordability for Brisbane residents has decreased. First home buyers in Melbourne have seen affordability increase, due to a softening in their market.
The unit markets in Melbourne, Sydney, and Hobart are seeing a comparable phenomena, with comparable median prices in each city. Overall, this provides a balancing act between the capital cities from a value viewpoint. We can no longer identify a single capital as being the most costly or the most inexpensive due to the existence of markets within markets based on the type of property and location.
Methodology
Each Affordable and Liveable Property Guide focuses on suburbs within a 20km radius of the CBD (or 10km for Hobart), taking into consideration the following criteria:
- Property trends criteria – all suburbs have a minimum of 20 sales transactions (or 10 transactions for Hobart) for statistical reliability purposes. Based on market conditions, suburbs have either positive, or as close as possible to neutral price growth between 2021 and 20221.
- Investment criteria – as of September 2022, all suburbs considered will have a similar or higher rental yield than the relevant City Metro area, and a similar or lower vacancy rate.
- Affordability criteria – identified suburbs have a median price below a set threshold. This threshold was set by adding a percentage premium to the respective state’s average home loan3. This percentage premium must result in a price threshold below the City Metro area’s median price to ensure affordability.
- Development criteria – suburbs identified must have a high total estimated value of future project development for the 2nd half of 20222, as well as a higher proportion of commercial and infrastructure projects. This ensures the suburbs show signs of sustainable economic growth, in turn positively affecting the property market.
- Liveability criteria – all identified suburbs have low crime rates, availability of amenities within a 5km radius (i.e., schools, green spaces, public transport, shopping centres and health care facilities), and an unemployment rate on-par or lower in comparison to the State average (as determined by the Department of Jobs and Small Business, June Quarter of 2022 release).
You can download all the Affordable and Liveable Property Guides 2nd half 2022 below:
Affordable and Liveable Property Guide 2nd Half 2022 - Brisbane
Affordable and Liveable Property Guide 2nd Half 2022 - Sydney
Affordable and Liveable Property Guide 2nd Half 2022 - Melbourne
Affordable and Liveable Property Guide 2nd Half 2022 - Hobart
Additional guides:
Affordable and Liveable Property Guide 2nd Half 2022 - Gold Coast
Affordable and Liveable Property Guide 2nd Half 2022 - Adelaide