National Affordable & Liveable Property Guide 2nd Half 2020
The PRD Affordable and Liveable Property Guides 2nd Half 2020 are available for Brisbane, Sydney, Melbourne and Hobart. These guides provide valuable insights and highlights of the market and report on many key indicators to create a holistic picture of property conditions in each capital city.

Overview
The PRD
Affordable and Liveable Property Guides 2nd Half 2020 are available for Brisbane, Sydney,
Melbourne, Hobart, Gold Coast, Canberra and Perth. These guides provide valuable insights and highlights of
the market and report on many key indicators to create a holistic picture of
property conditions in each capital city.
There were several key findings in the 2nd Half 2020 reports:
- The Melbourne Metro property market remained stable amid COVID-19 restrictions and the second lockdown, with median price growth of 1.5% for houses and 2.2% for units between 2019 and 20201. Although this may seem to be a more subdued level of growth for Melbourne Metro, under current COVID-19 conditions it showcases market strength. Furthermore, the Melbourne Metro market is now more affordable compared with 2018, which makes it an opportune time for first home buyers to enter the market.
- Hobart Metro recorded the lowest vacancy rate in September 2020, of 0.6%. This is significantly lower than the Real Estate Institute of Australia’s healthy benchmark of 3.0% and signals a return to the pre-COVID-19 vacancy rate environment (also 0.6% in December 2019). That said Brisbane Metro showed the greatest improvement in vacancy rates, trending down to 2.0% in September 2020, which was even lower than pre-COVID-19 times (2.9% in December 2019). This dispels investor concerns regarding an oversupplied rental market in Brisbane.
- Suburbs selected as affordable and liveable were equally spread in the Melbourne Metro and Hobart Metro, in terms of geographical location compared with the CBD. However, they were concentrated in the south-west of Sydney Metro and on the northside of Brisbane Metro, indicating that residents in Melbourne and Hobart have a slight advantage.
- Hobart continues to be the only capital city where residents must sacrifice affordability for liveability. Residents will need to be prepared to pay a premium of 92% for houses and 30% for units, above the Tasmanian (TAS) average home loan, to secure a highly liveable suburb. These premiums are much higher than the percentage required to purchase a median-priced property in Hobart Metro (62% for house and 22% for units).
- Sydney proves to be the most affordable city for
liveability, where residents can purchase a house in a liveable suburb for 70%
less (premium added to New South Wales average home loan) than the premium
needed to purchase in Sydney Metro. Melbourne Metro is the runner up at 41%
less, and Brisbane is third at 26% less.
Cost of Liveability
Table 1 illustrates the difference between the required premium percentage (added to the state average home loan3 for each capital city) to reach the respective City Metro median price, and the premium percentage required to identify affordable and liveable suburbs which met all methodology criteria (liveability, investment, and project development).
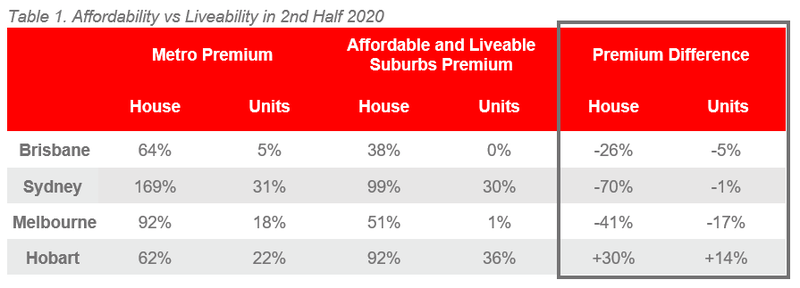
It is important to note that these premium percentages are affected by two key variables:
- median price movements in the market, and
- the ability of a suburb to meet the liveable criteria
The cost of liveability is the highest in Hobart, as it is the only capital city that recorded a positive premium difference (of +30% for houses and +14% for units). Hobart buyers need to be willing to pay more in exchange for better liveability.
Sydney was the most affordable city for liveability, closely followed by Melbourne. These two City Metro areas have recorded the largest negative premium difference for both houses and units, which is good news for residents.
This finding may surprise many, as Brisbane and
Hobart were originally thought of as the more affordable capital cities. While
this may be true from a median property price perspective, many affordable
suburbs in both capital cities fail to satisfy other criteria such as
liveability, investment return, and future project development plans.
Access to Market
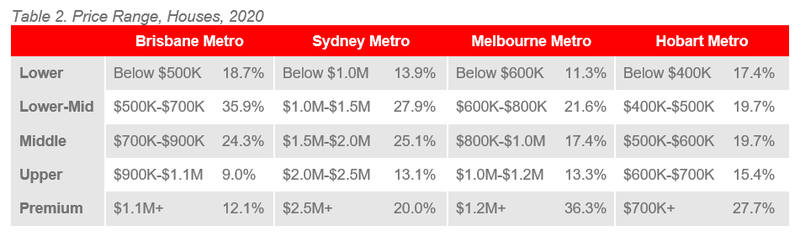
An analysis of price point sales, or access to market, highlights significant findings.
Firstly, Sydney Metro can now be classified as a haven for first home buyers, like Brisbane. The bulk of both house and unit sales in Sydney and Brisbane were in the lower-middle price brackets, although there was a significant difference in actual median property prices.
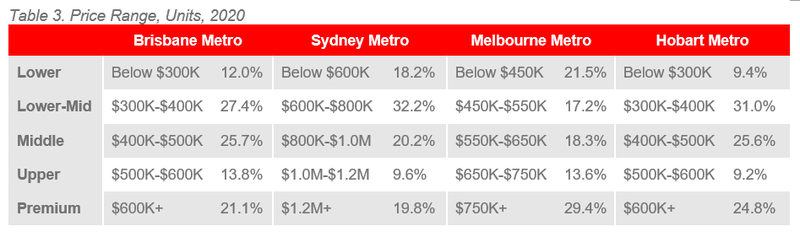
Second, Melbourne Metro proves to be a “split” capital city, with equal activity in both the lower and premium price brackets, particularly for units. This is potentially due to COVID-19 restrictions, where standard configuration units and/or units in highly impacted areas have become more affordable, however unique premium priced apartments have held value. This provides opportunities for first home buyers to enter the market.
Thirdly, Hobart proves to be the least friendly market for first home buyers, particularly for houses. The bulk of house sales were in the premium price bracket, which suggests that those looking for affordable houses need to act swiftly. The Hobart unit market is friendlier to first home buyers, as there is a “split” unit market; both lower-middle price and premium price brackets show equally high sales activity.
Lastly, Brisbane’s and Hobart’s unit markets were now at equal price categories, with a middle price bracket being $400,000 to $500,000. Sydney remains the most expensive capital city for both houses and units, with its middle price brackets being the highest priced. For example, a middle-priced house in Brisbane sits within $700,000 to $900,000, whereas in Sydney it is $1.5m-$2.0m – essentially double the price.
Affordable & Liveable Suburbs - National
Considering all methodology criteria (property trends, investment potential, affordability, project development, and liveability factors), Table 4 identifies key affordable and liveable suburbs which property watchers should focus on in 2020.
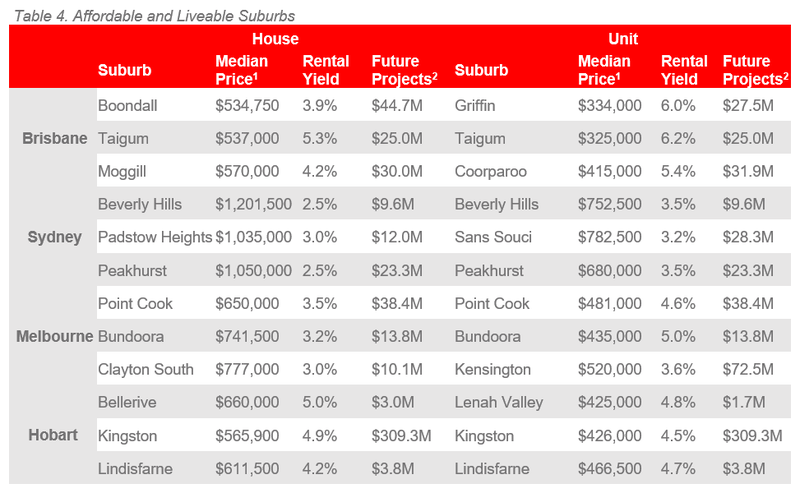
It is evident that in general, Sydney and Melbourne have the highest entry prices, yet the lowest rental yields. This is a similar pattern to the 1st Half 2020µ report, despite COVID-19 restrictions and further lockdowns in both capital cities. Hobart median prices are now on-par with Brisbane, which suggests affordability in Hobart has declined. Comparing all affordable and liveable suburbs within all capital cities, Brisbane arguably provides home buyers and investors with the most “bang for buck”. This is particularly true in the unit market, due to having the lowest median prices and highest rental yields.
Methodology
Each report focuses on suburbs within a 20km radius of the CBD (or 10km for Hobart), taking into consideration the following criteria:
- Property trends criteria – all suburbs have a minimum of 20 sales transactions (or 10 transactions for Hobart) for statistical reliability purposes. Based on market conditions suburbs have either positive, or as close as possible to neutral price growth between 2019 to 20201.
- Investment criteria – as of September 2020, all suburbs considered will have a similar or higher rental yield than the relevant City Metro area, and a similar or lower vacancy rate.
- Affordability criteria – identified suburbs have a median price below a set threshold. This threshold was set by adding a percentage premium to the respective state’s average home loan3. This percentage premium must result in a price threshold below the City Metro area’s median price in order to ensure affordability.
- Development criteria – suburbs identified must have a high total estimated value of future project development for the 2nd half of 20202, as well as a higher proportion of commercial and infrastructure projects. This ensures the suburbs show signs of sustainable economic growth, in turn positively affecting the property market.
- Liveability criteria – all identified suburbs have low crime rates, availability of amenities within a 5km radius (i.e. schools, green spaces, public transport, shopping centres and health care facilities), and an unemployment rate on-par or lower in comparison to the relevant State average (as determined by the Department of Jobs and Small Business, June Quarter 2020 release).