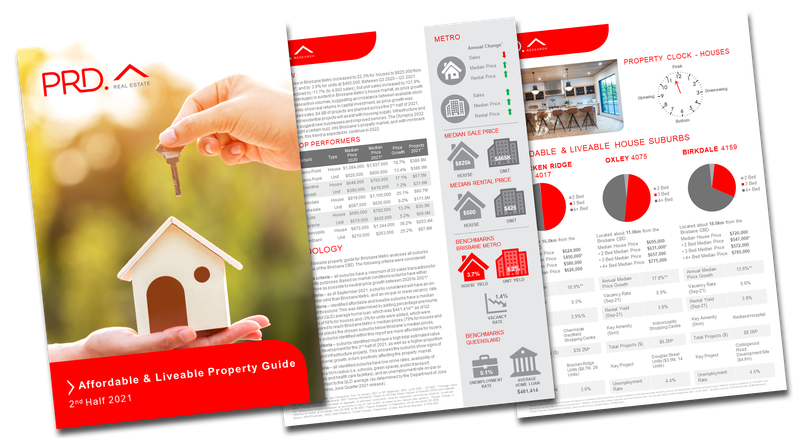
Affordable & Liveable Property Guides 2nd Half 2021
The PRD Affordable and Liveable Property Guides 2nd Half 2021 are available for Brisbane, Sydney, Melbourne, and Hobart. These guides provide valuable insights and highlights of the property market and report on many key indicators to create a holistic picture of the property conditions in each capital city.
Overview
The PRD Affordable and Liveable Property Guides 2nd Half 2021 are available for Brisbane, Gold Coast, Sydney, Melbourne, and Hobart. These guides provide valuable insights and highlights of the property market and report on many key indicators to create a holistic picture of the property conditions in each capital city.
Download reports:
PRD Affordable and Liveable Property Guides 2nd Half 2021 - Brisbane
PRD Affordable and Liveable Property Guides 2nd Half 2021 - Gold Coast
PRD Affordable and Liveable Property Guides 2nd Half 2021 - Sydney
PRD Affordable and Liveable Property Guides 2nd Half 2021 - Melbourne
PRD Affordable and Liveable Property Guides 2nd Half 2021 - Hobart
Key Findings
- Sydney continues to prove itself to be the most affordable city, not from a dollar median house price perspective, but from a cost of liveability perspective. Sydney residents can purchase a house in a liveable suburb; one that ticks all the boxes in terms of access to amenities, less crime, and planned development for future growth; for 105% on top of the New South Wales average loan. This is 78% less than the 183% that must be added to the New South Wales average loan to afford Sydney Metro median house price.
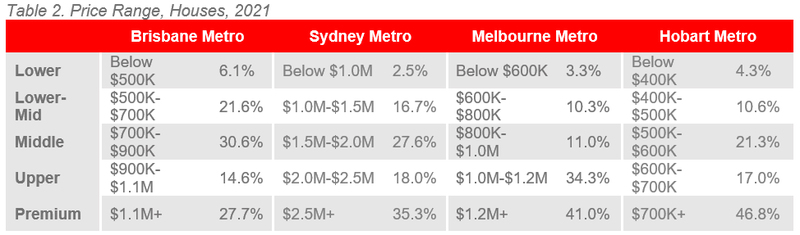
- Brisbane continues to be a haven for first home buyers, despite the current increase in median house prices and movement towards a more premium price bracket. Those with lower and lower-mid affordability levels can access 27.7% of Brisbane’s market. In comparison, those with the same affordability level can only access 19.3% of the Sydney, 13.6% of Melbourne, and 14.9% of Hobart markets.
- Hobart has eclipsed Brisbane in terms of being the more expensive capital city. Hobart residents must add 92% on top of the Tasmania state average home loan to be able to afford a house in Hobart Metro, whereas Brisbane residents need to add 79% on top of the Queensland state average home loan. This makes Brisbane one of the more affordable capital cities compared to Sydney, Melbourne, and Hobart.
Cost of Liveability
Table 1 illustrates the difference between the required premium percentage (added to the state average home loan3 for each capital city) to reach the respective City Metro’S median price, and the premium percentage required (also added to the state average home loan3 for each capital city) to identify affordable and liveable suburbs which have met all methodology criteria (i.e liveability, investment, and project development).
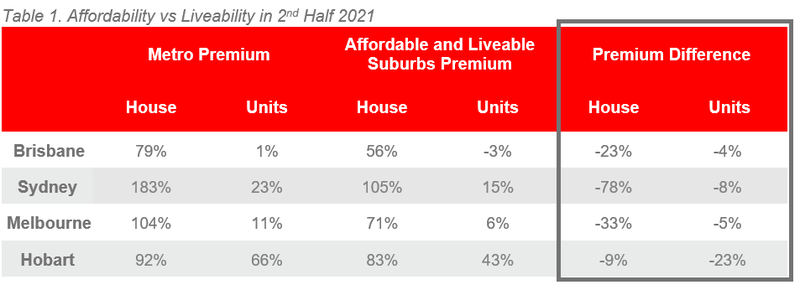
It is important to note that these premium percentages are affected by two key variables:
- median price movements in the market, and
- the ability of a suburb to meet the liveable criteria
The cost of liveability, particularly for those wanting to purchase a house, is still the highest in Hobart. It is the capital city that recorded the lowest premium difference (see table 1). This suggests that Hobart residents must be prepared to spend close to the Hobart Metro median house price to secure a home that ticks all the liveability criteria set.
Sydney continues to be the most affordable city for liveability, continuing to record the largest negative premium difference for houses, as per the 2nd half 2020µ and 1st half 2021ϖ reports. This is good news for first home buyers, who may believe they have to sacrifice liveability aspects to gain access into suburbs with a lower median property price than Sydney Metro.
This finding may surprise many, as Brisbane and Hobart are typically thought of as the more affordable capital cities. Whilst this might be true from a median property price perspective, many lower-priced suburbs (compared to capital city prices) in Brisbane and Hobart fail to satisfy other criteria such as liveability, investment return, and future project development plans.
For Hobart particularly, a double-pronged issue exists. Firstly, there is an undersupply of housing stock in suburbs that meet all liveability criteria, resulting in continuous median price growth. This results in highly liveable suburbs having a higher median price than Hobart Metro itself, which fails the affordability test. Secondly, there is a need to build infrastructure and commercial capacity in suburbs that pass the affordability test, to increase local employment and ensure the suburbs can pass other liveability criteria set.
Access to Market
The analysis of price point sales, or access to market, highlights significant findings. Firstly, Sydney and Brisbane can continue to be classified as a haven for first home buyers, as per the 1st half 2021ϖ report revealed. Those with a budget classified as lower and lower-mid in both capital cities can access 27.7% of the Brisbane house market and 19.3% of the Sydney house market. That said, this figure has significantly reduced since the 1st half 2021ϖ, which were at 45.6% and 35.6% respectively.
Second, despite COVID-19 lockdowns since the release of the 1st half 2021ϖ report, both Sydney and Melbourne are seeing an increase in the number of sales in their middle, upper, and premium markets. This price-point made up 74.7% of sales in Melbourne, however, it has increased to 89% in the 2nd half of 2021. Similarly, in Sydney, this price point made up 51.5% of sales in the 1st half of 2021ϖ, however, now makes up 80.9% of sales in the 2nd half of 2021.
Thirdly, Hobart remains the least friendly market for first home buyers, even more significantly in the 2nd half of 2021. In the 1st half of 2021ϖ buyers with a lower and lower-mid level budget could access 33.3% of the market. However, now they can only access 14.9% of houses.
Affordable & Liveable Suburbs
Considering all methodology criteria (property trends, investment potential, affordability, project development, and liveability factors), Table 4 identifies key affordable and liveable suburbs which property watchers should look out for in 2021.
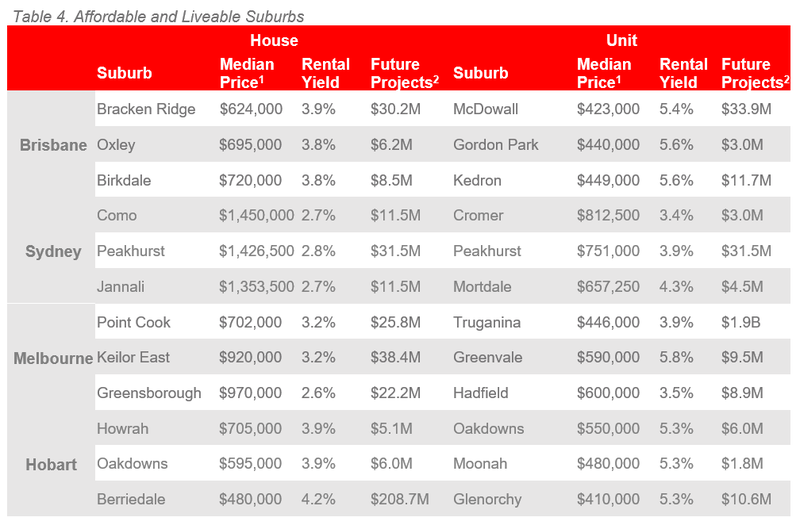
The Affordable and Liveable Property Guides 2nd Half 2021 highlight interesting movements in property trends between Brisbane, Sydney, Melbourne, and Hobart.
Sydney continues to be the most expensive capital city from a median price perspective, with the lowest rental yield. Melbourne shared the same sentiment in the 1st half of 2021ϖ, however not in the 2nd half, with some of the affordable and liveable suburbs identified, such as Point Cook and Truganina were shown to have lower median prices than suburbs nominated in Brisbane and Hobart.
Brisbane and Hobart share the title of most ‘bang for buck’ in the 2nd half of 2021, having a larger proportion of affordable and liveable suburbs identified with lower median prices and higher rental yield. This proves advantageous for Brisbane residents, particularly as Brisbane has the largest percentage (27.7%) available to buyers with lower and lower-middle budgets. Hobart has less percentage available, of 14.9%, which indicates the need for more housing supply at this price point.
Methodology
Each Affordable and Liveable Property Guide focuses on suburbs within a 20km radius of the CBD (or 10km for Hobart), taking into consideration the following criteria:
- Property trends criteria – all suburbs have a minimum of 20 sales transactions (or 10 transactions for Hobart) for statistical reliability purposes. Based on market conditions, suburbs have either positive, or as close as possible to neutral price growth between 2020 to 20211.
- Investment criteria – as of September 2021, all suburbs considered will have a similar or higher rental yield than the relevant City Metro area, and a similar or lower vacancy rate.
- Affordability criteria – identified suburbs have a median price below a set threshold. This threshold was set by adding a percentage premium to the respective state’s average home loan3. This percentage premium must result in a price threshold below the City Metro area’s median price in order to ensure affordability.
- Development criteria – suburbs identified must have a high total estimated value of future project development for the 2nd half of 20212, as well as a higher proportion of commercial and infrastructure projects. This ensures the suburbs show signs of sustainable economic growth, in turn positively affecting the property market.
- Liveability criteria – all identified suburbs have low crime rates, availability of amenities within a 5km radius (i.e. schools, green spaces, public transport, shopping centres and health care facilities), and an unemployment rate on-par or lower in comparison to the State average (as determined by the Department of Jobs and Small Business, June Quarter 2021 release).
You can download all the Affordable and Liveable Property Guides 2nd Half 2021 below:
PRD Affordable and Liveable Property Guides 2nd Half 2021 - Brisbane
PRD Affordable and Liveable Property Guides 2nd Half 2021 - Gold Coast
PRD Affordable and Liveable Property Guides 2nd Half 2021 - Sydney
PRD Affordable and Liveable Property Guides 2nd Half 2021 - Melbourne
PRD Affordable and Liveable Property Guides 2nd Half 2021 - Hobart