Affordable & Liveable Rental Guide 2023
The Australian rental market has reached a point of severe stress, with many referring to current conditions as the "rental crisis". This report identifies key suburbs/areas in each capital city that hold a potential for renters. We have attempted to identify suburbs with a lower median rental price compared to the relevant capital city, as well as those with as high as possible confirmed incoming ready-to-sell stock, which targets the supply question.
The PRD Affordable and Liveable Rental Guide 2023 covers the following capital cities: Brisbane, Sydney, Melbourne, Hobart, Adelaide and Perth.
Key Findings
- Hobart, Adelaide and Perth proved to be the most challenging when identifying an affordable and liveable suburb to rent. To access to the greatest number of confirmed ready-to-sell stock planned, renters must either spend close to or higher than the capital city median rental price.
- Finding suburbs with a more affordable rental price (compared to the relevant capital city median rent) alongside a high confirmed number of incoming stock was not as difficult in Sydney and Melbourne, due to the high level of investment in this sector. This is quite surprising, given that these cities have the reputation of being more expensive.
- Melbourne was one of the "easiest" capital cities to find a lower rental priced suburb with a high level of confirmed incoming stock, allowing unit renters (in particular) the option of higher affordability and liveability.
- The Brisbane rental market proves to be “sticky”. Although there is a considerable amount of confirmed ready-to-sell stock in the pipeline, it is still below Sydney’s and Melbourne’s levels. Thus, identifying affordable suburbs with a high amount of confirmed stock was quite difficult in Brisbane. Those wanting a better chance of finding a rental property must spend close to the Brisbane metro rental price.
International Case Study - How do we compare?
The rental crisis is not just an Australia issue, but a significant issue in many international markets. For example, in New York and London, the proportion of the rent-to-income ratio for a 2-bedroom unit is more than 80%, leaving only approx. 20% for other living expenses. Interestingly, Hong Kong and Singapore have the lowest proportion of rent-to-income figures, at 13.1% and 24.8% respectively.
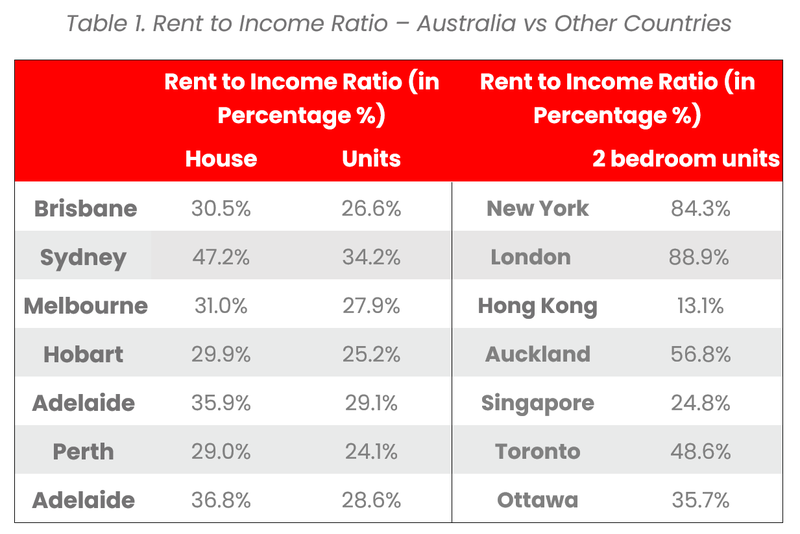
Domestically, Perth unit renters have the lowest proportion of rent-to-income percentage, at 24.1% as of Q2 2023. This is followed by Hobart (25.2%) and Brisbane (26.6%). For house renters, the lowest proportion of rent-to-income percentage can also be found in Perth (29.0%), Hobart (29.9%) and Brisbane (30.5%). Although technically this puts Hobart, Perth and Brisbane renters in a better position, it is still a higher percentage compared to 12 months prior. When combined with other increasing living costs it has a significant impact on the household budget, creating a stressful environment.
Compared to other major international cities, Australia is trending either similarly or more favourably. The proportion of rent-to-income for units is unsurprisingly the highest in Sydney, at 34.2%. However, this is lower than New York, London, Auckland and Toronto, and higher than Ottawa, Hong Kong and Singapore. Although this suggests that Australian renters are in a better position than some others across developed nations, it does not diminish the individual stress felt by different households.
Affordable and Liveable Suburbs
Table 2 identifies affordable and liveable suburbs that have met all criteria.
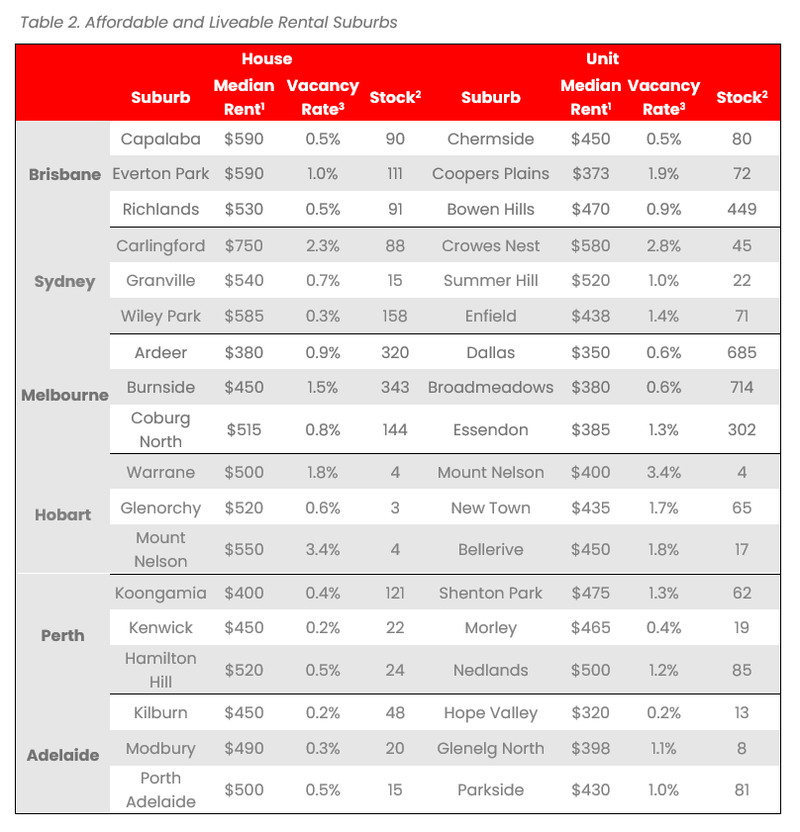
Due to the methodology of combining rental price and a high level of incoming ready-to-sell stock, this report does not necessarily identify the cheapest areas to rent. A key finding is two-fold:
a) very tight supply of ready-to sell stock in capital cities (Adelaide and Hobart)
b) renters at times must make a hard choice between affordability versus supply.
Methodology
This affordable and liveable rental guide analyses all suburbs within a 20km radius of the CBD (or 10kms for Hobart). The following criteria were used:
- Property trends criteria – all suburbs have a minimum of 20 rented properties for statistical reliability purposes.
- Affordability criteria – identified suburbs must have a median rental price below the relevant capital city median rental price.
- Supply criteria – suburbs must have a high number of confirmed and/or possible residential and/or mixed-use projects in the 1st half of 2023, delivering ready-to-sell stock to market. This can be dwellings, units or townhouses.
- Liveability criteria – all suburbs have low crime rates, availability of amenities within a 5km radius (i.e. schools, green spaces, public transport, shopping centres and health care facilities), and an unemployment rate on-par or lower in comparison to the relevant state average (as determined by the Department of Jobs and Small Business, December Quarter 2022 release).
Disclaimer
1Median rental price quoted is per week, capturing historic/rented properties in Q2 2023 (1st April – 30th June 2023) 2Number of confirmed stock represents total dwellings, townhouses and units to be delivered by either mixed-use or residential projects, scheduled to commence in the 1st half of 2023 as stated by the relevant data authority. 3Rental yield and vacancy rate figures are as of June 2023, provided by SQM Research.