Q1 2019 Key Market Indicators – Australian Capital Territory
The Australian Capital Territory (ACT) continues to perform in the PRD Q1 2019 Key Market Indicator Awards; earning 4 gold, 1 silver, and 1 bronze award nationally. The ACT has once again earned the gold award nationally for the highest home loan affordability index reading, at 50.0 index points in the September quarter of 2018. This is a 4.4% increase within a 12-month period, previously at 47.9% in the June quarter of 2018.
Australia Capital Territory continues to perform
The Australian Capital Territory (ACT) continues to perform in the PRD Q1 2019 Key Market Indicator Awards; earning 4 gold, 1 silver, and 1 bronze award nationally.
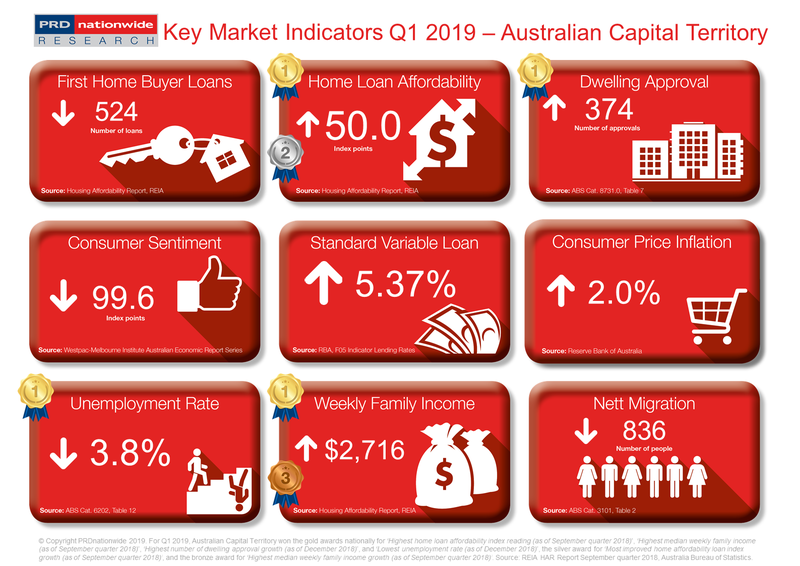
The ACT has once again earned the gold award nationally for the highest home loan affordability index reading, at 50.0 index points in the September quarter of 2018. This is a 4.4% increase within a 12-month period, previously at 47.9% in the June quarter of 2018.
The ACT home loan affordability index is currently significantly higher than the Australian average of 31.9 index points. There are several factors that support this. Firstly, the median price for houses in the ACT was $686,750 in 2018, which is lower than Sydney Metro. Secondly, ACT earned a gold award nationally for the lowest unemployment rates, at 3.8% in December 2018, which is a -2.6% decline compared to 12 months prior. This suggests that ACT not only has the highest number of people employed and earning an income, but the number of people earning an income has improved. Thirdly, ACT earned a gold award nationally for the highest median weekly family income, at $2,716 per week in the September quarter of 2018. This represents a 2.4% growth over a 12-month period and is above both the New South Wales median weekly family income of $1,756 per week, as well as the Australian average of $1,755 per week.
The above 3 key indicators put the ACT in prime position for having a high home loan affordability index, as the ACT’s property market pricing and economic conditions are supportive of each other.
There is a further upswing in residential development activity within ACT, earning the state a gold award nationally for the highest number of dwelling approval growth (as of December 2018), up by 35.5% to reach 374 approvals. Although this is lower than the 12-month growth to September 2018 of 64.2%, it still indicates that there is a high volume of housing stock to come into the ACT market in 2019. This will assist in catering to current demand and may even tip the balance slightly to an oversupply, resulting in higher affordability in the medium-term future.
The PRD Q1 2019 Key Market Indicators provide a quick snapshot of the current state of the market in Australia, from both an economic and property perspective. The Indicators cover both national and state level data, comprising of:
- Number of loans to first home buyers
- Home loan affordability index
- Number of dwelling approvals
- Consumer sentiment index
- Standard variable loan
- Consumer price inflation index
- Unemployment rate
- Weekly family income
- Nett migration
View the Q1 2019 Key Market Indicators


